Curated OER
Plastic Pollution
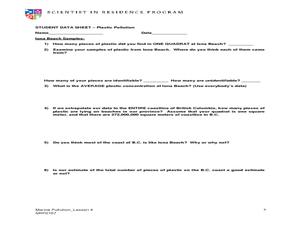
Students determine with math concepts how much plastic pollution is affecting marine life. In this plastic pollution lesson plan, students collect scientific data from a field trip to a water treatment plant.
Curated OER
High School Mathematics Problems from Alaska: Extensions of Data: Barrow, Alaska Sunrise/Sunset Information
Young scholars using given data to extrapolate new information, using a linear equation to predict later behavior, and using previous knowledge to synthesize new conjectures.
Curated OER
Data Days
Sixth graders practice collecting, organizing and displaying data. They create circle, bar, line and picto graphs. They analyze data in small and large sample groups.
Curated OER
Determining the Enthalpy Change of a Reaction
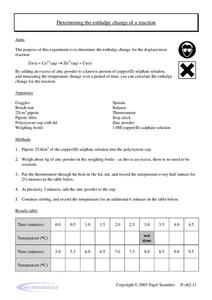
In this enthalpy of reactions learning exercise, students use a known amount of copper (II) sulphate solution and an excess of zinc powder to calculate the enthalpy change of the reaction. Students measure the temperature change over the...
Texas Instruments
Math TODAY for TI-Navigator System - Is Leisure Time Really Shrinking?
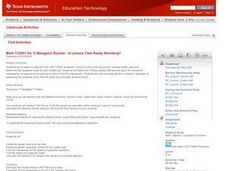
High schoolers organize data from the USA TODAY Snapshot, "Is leisure time really shrinking?" into two scatter plots and determine the quadratic model for each scatter plot. They determine if these graphs intersect and learn the concept...
Curated OER
Absolute Zero Lab
For this absolute zero worksheet, learners experiment with a closed-end syringe and a ice bath and boiling water. They record volumes of gases in the syringe as well as temperatures of the water and they plot their experimental data....
Curated OER
Numerical Analysis: Polynomial Interpolation
In this polynomial worksheet, students identify the interpolated and extrapolated value of given equations. This four-page worksheet contains approximately ten problems. Explanations and examples are provided.
Curated OER
Point Graphs
Students experiment with point graphs. In this math instructional activity, students are divided into groups and perform an experiment to see how high a ball bounces, recording their results on a point graph. Students then answer...
Curated OER
Survey Project
Eighth graders create a website using FrontPage. They use inserted forms to collect survey information and use Microsoft Excel and MS Word to create a presentation of the survey and the results.
Curated OER
STRETCHING SPRING
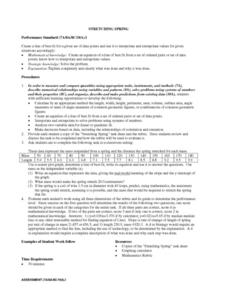
Students calculate the length, width, height, perimeter, area, volume, surface area, angle measures or sums of angle measures of common geometric figures. They create an equation of a line of best fit from a set of ordered pairs or...
Curated OER
How Do They Know That
Students explore methods for reconstructing the past. In this forest succession lesson, students examine forest succession and how to read the land in order to predict patterns of change. Students will visit a historical site, act as an...
Curated OER
What Can We Learn from Primary-Source Documents? Lesson 2
Students extrapolate information from primary-source documents. They read and research to create a whole-class timeline of events leading up to 1867 and Confederation.
Curated OER
Shaquille O'Neal Hand/Foot Span
Eighth graders measure foot length and hand span in this experiment to determine the ratio. They apply the ratio to determine Shaquille O'Neal's hand span if given his shoe size.
Curated OER
Numerical Analysis: Piecewise Polynomial Interpolation
In this interpolation worksheet, students use a linear interpolating polynomial and then describe the extrapolated value of the function. This four-page worksheet contains ten problems.
Curated OER
Using the Balance
Learners determine the mass of various objects. In this integrated math and science lesson, students use an arm balance to compare a known object to a combination of washers with a fixed weight. Learners record data, construct a bar...
Curated OER
Graph a Situation by Making a Table
Students graph scenarios values by making a table. In this algebra lesson, students rewrite word problems using algebraic symbols. They make a table of the data, make a graph and analyze the data to extrapolate.
Curated OER
Modeling Drug Assimilation in the Human Body
Students investigate the accumulation of drugs in the body. In this algebra instructional activity, students collect data on drug retention and assimilation. They use their data to predict the behavior and effects of drugs.
Curated OER
How Do They Relate? Linear Relationship
Students collect information and use a line to represent it. In this algebra lesson, students investigate real world data to see if it makes a line. They graph the line comparing the relationship of the x axis with that of the...
Curated OER
The Correlation Between Human Population Growth and Dwindling Natural Resources
Eighth graders predict human population growth. For this lesson, 8th graders discuss the length of time needed to double the human population, work in groups to chart population growth and predict population growth in the...
Curated OER
Dating Practices
Students interpolate, extrapolate, and make predictions from given information. They present results and conclusions from given data using basic statistics. Pupils create a survey from a critical question and decide which sampling...
Shodor Education Foundation
Playing with Probability
Review basic probability concepts with your class using different-colored marbles in a bag. Then pair up learners and have them play a cool online interactive game in which they race miniature cars using the roll of a die or...
Curated OER
Around the Clock
Students discover the relationship between the circumference of a circle and its diameter. They find the length of an arc of a circle.Students use estimation strategies in real-world applications to predict results (i.e., interpolation...
Curated OER
Sex & Reproduction
Students examine animal reproduction by interpreting data and making arguments and then create their own graphs to explore relationships of organ systems. This lesson includes an individual worksheet and a reflective review question for...
Curated OER
Mark, Recapture, Sampling
Learners conduct a simulation to explore how scientists estimate the size of animal populations. They analyze a random sample and then extrapolate those results to a larger population. Additionally, they will apply the principals of...


