Curated OER
Data
Students collect data from an experiment they perform. For this data lesson, students use multiple representations to solve practical problems; describe advantages and disadvantages of the use of each representation. Then, they evaluate...
Curated OER
Shaquille O'Neal Hand/Foot Span
Shaquille O'Neal has huge hands and feet, and learners will use those two measurements to practice collecting and extrapolating data using ratios. They record the measurement of foot and hand span of several of their classmates, then...
Curated OER
Shaquille O'Neal Hand & Foot Span
If Shaquille O'Neal wears a size-20 shoe, how big are his hands? Learners will use the average ratios of foot length to hand span to calculate the hand span of Shaq, but first, they have to collect the data! They will...
Curated OER
Cross Cultural Transportation and Resources Exchange
Students examine various modes of transportation. They explore regional transportation options and discover options available in their area. Students survey types of transportation people use in their area. Using spreadsheet data,...
Curated OER
Fire Wars
Your class can practice collecting and analyzing data. They extrapolate information and derive data from fire season statistics. They also choose the most appropriate format to display collected data.
Curated OER
Mathematics: A Picture's Worth a Thousand Words
Learners examine school yearbooks from 1950 to the present. They count the number of male and female teachers and administrators. They compile date and extrapolate changes in job trends.
Curated OER
Using Extrapolations
In this using extrapolations learning exercise, 6th graders use data analysis to answer nine questions about data prediction and extrapolation.
Curated OER
A Picture's Worth a Thousand Words
Students analyze the numbers of male vs female administrators and teachers from their school. In this gender equality lesson plan, students use school yearbooks from the 1950's threw present to count how many male vs. female teachers,...
Curated OER
Extraordinary Extrapolation
Students study how scientists have estimated the maximum height to which trees can grow, and assess the reliability of interpolation and extrapolation techniques by making predictions with particular data sets and analyzing accuracy of...
Curated OER
Beginning Modeling for Linear and Quadratic Data
Students create models to represent both linear and quadratic equations. In this algebra lesson, students collect data from the real world and analyze it. They graph and differentiate between the two types.
Curated OER
Interpreting Graphs
Students investigate graphs. In this graphing lesson, students create a graph regarding the population of California. Students extrapolate answers concerning the data set.
Kenan Fellows
How Does an Unhealthy Diet Influence our Health and Well-Being?
You are what you eat, or so they say! After surveying family and friends on a week of eating habits, learners analyze the data for patterns. They compare different variables such as fats and cost, fats and calories, or fats and LDLs.
Curated OER
Population Dilemma
Ninth graders explore population growth. In this Algebra I activity, 9th graders conduct an experiment simulating population growth. Students create a model and relate the results to a real-world situation. ...
Curated OER
How Alike Are We?
Fourth graders find the range, mode, median, and mean for each of the data sets (height and shoe size). They discuss which measure of central tendency for each data set best represents the class and why. Students graph the shoe size and...
Curated OER
Linear Patterns in Data
Eighth graders extend their learning of graphing linear equations and are introduced to connecting patterns in tables and graphs to represent algebraic representations. They then determine patterns and extrapolate information from these...
Curated OER
Just Me and My Shadow
Students take measurements throughout the day using a simple sundial called a gnomon. They record the results on a Data Log and convert from English units to metric (S.I.) units. Data points are plotted on the same graph and analyzed.
Curated OER
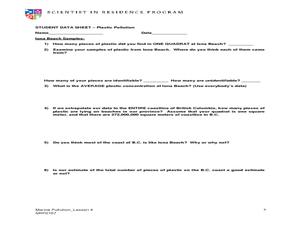
Plastic Pollution
Students determine with math concepts how much plastic pollution is affecting marine life. In this plastic pollution lesson plan, students collect scientific data from a field trip to a water treatment plant.
Curated OER
High School Mathematics Problems from Alaska: Extensions of Data: Barrow, Alaska Sunrise/Sunset Information
Young scholars using given data to extrapolate new information, using a linear equation to predict later behavior, and using previous knowledge to synthesize new conjectures.
Curated OER
Data Days
Sixth graders practice collecting, organizing and displaying data. They create circle, bar, line and picto graphs. They analyze data in small and large sample groups.
Texas Instruments
Math TODAY for TI-Navigator System - Is Leisure Time Really Shrinking?
High schoolers organize data from the USA TODAY Snapshot, "Is leisure time really shrinking?" into two scatter plots and determine the quadratic model for each scatter plot. They determine if these graphs intersect and learn the concept...
Curated OER
Numerical Analysis: Polynomial Interpolation
In this polynomial worksheet, students identify the interpolated and extrapolated value of given equations. This four-page worksheet contains approximately ten problems. Explanations and examples are provided.
Curated OER
Point Graphs
Students experiment with point graphs. In this math instructional activity, students are divided into groups and perform an experiment to see how high a ball bounces, recording their results on a point graph. Students then answer...
Curated OER
Survey Project
Eighth graders create a website using FrontPage. They use inserted forms to collect survey information and use Microsoft Excel and MS Word to create a presentation of the survey and the results.
Curated OER
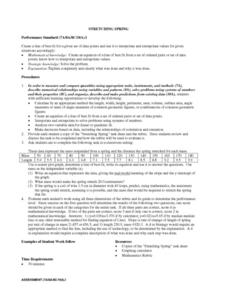
STRETCHING SPRING
Students calculate the length, width, height, perimeter, area, volume, surface area, angle measures or sums of angle measures of common geometric figures. They create an equation of a line of best fit from a set of ordered pairs or...


