Curated OER
Dating Practices
Students interpolate, extrapolate, and make predictions from given information. They present results and conclusions from given data using basic statistics. Pupils create a survey from a critical question and decide which sampling...
Curated OER
History Repeats Itself
Twelfth graders research historical turning points, gather-data, and extrapolate possible alternate outcomes. They work individually to choose one historical event from Attachment D, Historical Turning Points. Students complete either...
Curated OER
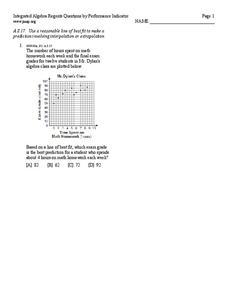
Line of best fit
In this Algebra I/Algebra II worksheet, students determine the line of best fit for a scatter plot and use the information to make predictions involving interpolation or extrapolation. The one page worksheet contains one multiple...
Curated OER
The Use of Myths in Science
Students examine folk tales to determine the basis for scientific myths. They demonstrate through the discussion of the folk tales that the perception of the world has changed as new information is gained. They write their own folk...
Curated OER
How Women Got the Vote: The Story of Carrie Lane Chapman Catt
Students participate in a simulation and compare and contrast the arguments for and against womens' right to vote. In this civil rights lesson plan, students simulate disenfranchisement of women by allowing only half of the class to vote...
Canadian Museum of Civilization Corporation
Artifacts Tell Stories: Creating a First World War Museum in the Classroom
Although designed for the Canadian War Museum, the concept here is a solid one. Class members select an artifact from the First World War, examine it, research it, and craft an explanative label that they attach to their picture and post...
Kenan Fellows
How Does an Unhealthy Diet Influence our Health and Well-Being?
You are what you eat, or so they say! After surveying family and friends on a week of eating habits, learners analyze the data for patterns. They compare different variables such as fats and cost, fats and calories, or fats and LDLs.
Curated OER
Rapid Ecological Assessment
Students conduct an ecological assessment of a small area on school property and apply findings to the greater area. They inventory the plant and animal population of a sample area and extrapolate results to a larger area.
Curated OER
Survey Project
Eighth graders create a website using FrontPage. They use inserted forms to collect survey information and use Microsoft Excel and MS Word to create a presentation of the survey and the results.
Curated OER
An Enthusiastic Age: A History of Minoan Pottery
Young scholars explore and gather relevant facts from a website about Minoan pottery. They present their information to the rest of the group in different ways: PowerPoint, handouts, timeline.
Curated OER
Compatible Numbers To Ten
Students solve both addition and subtraction facts and discover the relationship between adding and subtracting equations. Students read real life word problems, extrapolate needed information, and write equations to solve the story...
Curated OER
How Do They Know That
Students explore methods for reconstructing the past. In this forest succession lesson, students examine forest succession and how to read the land in order to predict patterns of change. Students will visit a historical site, act as an...
Curated OER
How Do They Relate? Linear Relationship
Students collect information and use a line to represent it. In this algebra lesson, students investigate real world data to see if it makes a line. They graph the line comparing the relationship of the x axis with that of the...
Curated OER
Carbons to Computers
Students collect, organize, and analyze primary and secondary source information that documents a local office. (Students synthesize what they have learned to predict the office's organization and functions in the year 2025.)
Curated OER
An Investigative Task
Students read an article about statistics. In this statistics lesson, students are given a detailed overview about statistics and what it entails. This lesson is more informational and hands on.
Curated OER
Just Spray 'Em!?
Students read the label of an insecticide and identify pertinent information. They tell that the higher the LD50 the less toxic the chemical. Students begin to extrapolate the impact of pesticide use beyond the death of the insect.
Curated OER
Track's Slippery Slope
Students graph data of sports figure running time using x-axis y-axis to find slope of trend line, mathematically find the interpolated and extrapolated values for data points. Using the information they make predictions.
Curated OER
The New England Fishing Industry:Sea Changes in a Community
Explore New England's economic and cultural past and possible issues New Englanders will face in the future. Middle and high schoolers research the fishing industry and the need for regulation. They analyze the topography of New England...
Howard Hughes Medical Institute
Patterns in the Distribution of Lactase Persistence
We all drink milk as babies, so why can't we all drink it as adults? Examine the trend in lactase production on the world-wide scale as science scholars analyze and interpret data. Groups create pie charts from the data, place them on a...
Curated OER
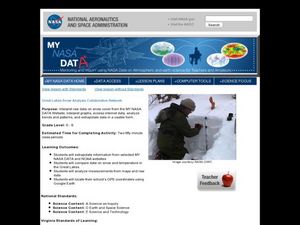
Great Lakes Snow Analysis Collaborative Network
Young scholars interpret data on snow cover and analyze trend patterns. In this snow lesson students compare data and locate their school's GPS coordinates.
Curated OER
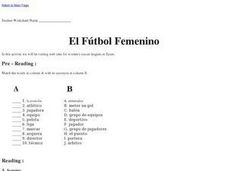
El Fútbol Femenino en España
Students use a worksheet to help focus their research on Spain's national women's soccer league. They access primary sources in Spanish and write a journalistic article using their findings.
Curated OER
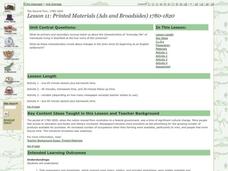
Lesson 11: Printed Materials (Ads and Broadsides) 1780-1820
Young scholars use primary resources (gazettes, broadsides, advertisements) to consider life at the turn of the 18th century in Deerfield, Massachusetts. They infer observations about life in the nascent United States.
Curated OER
It's Not All Greek to Me
Learners find out the meaning for prefixes used in math vocabulary. By dissecting words used in everyday math, they figure out what the prefix indicates and what the word means. A variety of well-organized worksheets and activities...
Space Awareness
Valleys Deep and Mountains High
Sometimes the best view is from the farthest distance. Satellite imaging makes it possible to create altitude maps from far above the earth. A three-part activity has your young scientists play the role of the satellite and then use...


