Curated OER
Graphs
Students list their favorite cars and create graphs of their favorites. Students determine how the graphs would change as their choices change.
Curated OER
Collecting Data and Graphing
Eighth graders, in groups, count the different colors of M&M's in each kind of package and then draw a pictograph to show the results. Each group writes a program to show their results and then compare the manually-drawn and computer...
Curated OER
Get Ready For Some Football
Sixth graders compare and contrast the totals from two national football teams for the year. Using the internet, they search for the information they need and create a data bar graph. They use the information they collected to answer...
Curated OER
Pancakes, Anyone?
First graders explore data collecting and graphing. In this data collecting and graping lesson, 1st graders watch a video about monster who sells pancakes. Students make a graph to record the most popular pancake. Students also play...
Curated OER
And Around We Go!
Sixth graders conduct a survey and collect data to construct a bar graph that will then be changed into a circle graph. With the bar graph, 6th graders compare estimated fractions and percentages and estimate percentages. With the circle...
Curated OER
Chart This!
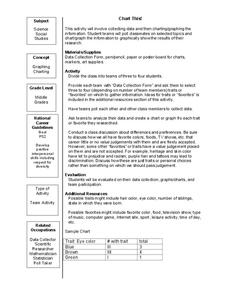
Students collect data and graph or chart the information. In this data organization lesson, students poll their classmates about certain topics and chart or graph the information to show the results of their research.
Curated OER
Data collection and analysis
In this probability and statistics activity, high schoolers determine when a survey or collected data could be biased. The one page activity contains a combination of three multiple choice and free response questions. Answers are...
Curated OER
Chart This!
Students collect and analyze data. For this middle school mathematics lesson, students collect data on three to four traits or favorites. Students analyze their data and create a chart of graph for each trait or favorite they researched.
Curated OER
Activity Plan 5-6: What's In a Name?
Students use family names to gather and analyze data. In this counting instructional activity, students use graph paper to help organize their data and then, in a staircase fashion, organize the names from longest to shortest so they...
Curated OER
Getting to Know You
After going over the five steps of the writing process, pupils fill out "Getting to Know You" worksheets. They trade papers with each other, and have the task of writing a descriptive paragraph about the person whose worksheet they...
Curated OER
Economics Study Guide
Use this resource as a basic review of economic principles. There are six questions relating to the factors of production, opportunity costs, wants and needs, tangibles and intangibles, and more.
Curated OER
Sorting Through Spiders
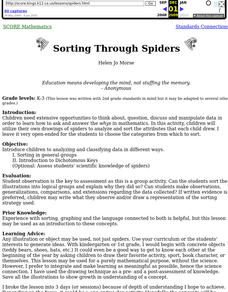
Young scholars utilize their own drawings of spiders to analyze and sort the attributes that each student drew.


