Curated OER
Geometric Figures
Students compare, classify and calculate the area of geometric figures such as rectangles, squares, circles and triangles.
Curated OER
The World in a Classroom
Students calculate percentages of different kinds of people in the world. In this diversity lesson plan, students will see the percentages of different people and different incomes based on if the world only had 100 people in it.
Curated OER
7th Grade Math Circle Graphs
Seventh graders are able to develop (synthesis) pie graphs with the class and on their own. They are told that pie charts are a graphic representation of material that can be given in the form of parts of a whole by using...
Curated OER
Missouri Rice Farming
Sixth graders investigate rice farming in Missouri. In this percentages lesson, 6th graders determine how much rice production has increased over time. Students find this number in percentages. Students then figure the percent of acres...
Positively Autism
Knights and Castles Boy/Girl Sort
Learners with autism examine a series of cards with drawings and photographs of knights and ladies, and then sort the images onto printed pages labeled "boys" and "girls." All the figures are dressed in courtly attire.
Curated OER
Unit Conversions
In this unit conversions worksheet, students calculate and convert measurements from one unit to another. They complete 109 short answer and problem solving questions involving unit conversions.
Curated OER
Percent Box
Students examine the procedures to determine a number when the percentage of the whole is known or to find the whole number when the part or percentage is known.
Curated OER
Measuring the Area of a Circle
When mathematical errors happen, part of the learning is to figure out how it affects the rest of your calculations. The activity has your mathematicians solving for the area of a circular pipe and taking into consideration any errors...
Illustrative Mathematics
Anna in D.C.
The amount of tax and tip on a restaurant bill is a common example used in percent problems. Here, learners only know the total amount paid, and they need to figure the itemized amounts. Solutions using a ratio table, using knowledge of...
Curated OER
Decimals, Percents, and Fractions
Learners practice converting fractions, decimals, and percentages to communicate equal amounts. They fill in a table, determine the percentage of a total area that is shaded in diagrams, complete equations with decimals to the hundredths...
Teacher Created Resources
How to Calculate Discounts and Sales
Teach discounts and sales with a straightforward worksheet. After reviewing the concept, pupils solve word problems related to dollars and percentages. The second half of the sheet prompts learners to continue solving problems related to...
Curated OER
Unit Squares and Triangles
This is an interesting geometry problem. Given the figure, find the area of a triangle that is created by the intersecting lines. The solution requires one to use what he/she knows about coordinate geometry, as well as triangle and angle...
Illustrative Mathematics
Battery Charging
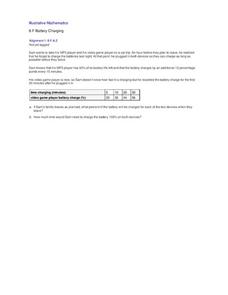
Your class will be very interested in the results of this activity. How long does it take a MP3 and video game player to charge? Sam only has an hour and the MP3 player only has 40% of its battery life left. Plus, his video player is...
Illustrative Mathematics
Area of a Trapezoid
Here is a straightforward example of how to apply the Pythagorean Theorem to find an unknown side-length of a trapezoid. Commentary gives additional information on proving that the inside of the trapezoid is a rectangle, but is...
Illustrative Mathematics
Giantburgers
What is a million between friends? This fast food chain claims to serves a certain percentage of Americans every day. The resource agrees, but depending on how you calculate it, you could be a million off. Let your fast food munchers be...
Virginia Department of Education
Partial Pressure
At some point, everyone has been under pressure—even Dalton! Explore Dalton's law of partial pressures with young chemists as they measure the volume of air extracted from a sample compared to its original volume. Class members perform...
Mathematics Assessment Project
Yogurt
Daily production of dairy? Determine profit and production requirements for a yogurt company with unit conversions and percentages to solve problems.
Curated OER
Miami Seaquarium and Mathematics
Eighth graders, in groups, go on an imaginary field trip to Miami Seaquarium and figure out what the total cost of the trip would be.
Curated OER
Mathematical Magazines
Students look through magazines and calculate the percentages of the types of ads in the magazines. In this percentages lesson plan, students create a graph to show their results.
Curated OER
Fractions: Jewish Population of Europe during WWII
Students evaluate population maps and convert fractions to percentages. In this WWII lesson, students use statistics on the Holocaust to determine population loss and change. Students create their own math questions and answers using the...
Curated OER
Percent
In this percentage activity, 5th graders figure a given percentage for a particular number. Students solve for 12 problems giving the number amount for each percentage stated.
Curated OER
Beginning Fractions
In this beginning fractions worksheet, students follow the directives of eight equations that ask the students to shade in a certain percentage of each shape. Students then write the fraction that represents each shaded portion.
Education World
The African American Population in US History
How has the African American population changed over the years? Learners use charts, statistical data, and maps to see how populations in African American communities have changed since the 1860s. Activity modifications are included to...
Curated OER
What's Along the Coast?
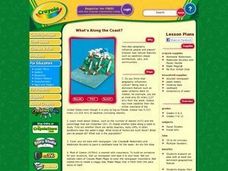
Students research an area with at least one dominant geographical feature. Then they display their findings in a realistic 3-dimensional presentation. Students also prepare ancillary material to support their project. Finally, they chart...


