Curated OER
Alcohol Use, Abuse, and Alcoholism
Students examine influences contributing to alcohol use and abuse. They asses the genetic and environmental factors involved in alcoholism. They create a histogram for modeling alcohol use and calculate the results into percentages of...
Curated OER
Parabolas
In this parabolas worksheet, 10th graders solve and draw 10 different problems with figures related to various parabolas. First, they determine the vertex, focus, and the directrix in each equation. Then, students draw the parabola on a...
Curated OER
Fractions to Percent
In this fraction worksheet, 6th graders change fractions to percent. Students complete 10 matching questions connecting the given fraction to its correct percentage amount.
Curated OER
Estimation With Percents
Students examine percents. In this percents lesson, students will estimate percentages. Using advertisements from a newspaper, students problem solve to determine the final price of a sale item.
Curated OER
Estimating Percents
In this math worksheet, students complete 25 problems where they estimate the percentage of shaded figures, fractions of a whole, and by solving word problems which use percents.
Curated OER
The Car Pool is Coming
Students evaluate the number of people who travel out of their town to work. They figure out what the percentage of each town's commuting workers is to the number who commute in the region. They plot the percentages on a pie chart.
Curated OER
Currency Exchange Rates
Students, in groups, choose three countries from which to investigate exchange rates versus the US dollar. Using Internet research they follow daily exchange rates and compute the percentage change. They compile data and prepare and...
Curated OER
Topics in Math
In this consumer mathematics worksheet, students explore a variety of topics in mathematics including simple interest, perimeter, area, volume, translating words into symbols, percentage problems and mortgage calculations. The fourteen...
Curated OER
Surveys
Students collect data from middle school survery. They tabulate percentages by grade level. They create a graph to display the survey results.
Curated OER
Estimating for Accuracy
Young scholars are introduced to the topic of estimation. Using various methods, they estimate and calculate the answers with the use of a calculator. They develop a practice to always estimate answers involving percentages and use a...
Curated OER
Kari's Earth Care
Students explore caring for their community. They select an area of a park to clean and collect trash. They place materials in trash bags to recycle plastic, paper, etc. They calculate the amount of items and percentages they collect...
Curated OER
After Christmas Specials
In this math worksheet, learners solve 4 story problems which pertain to after-Christmas shopping. Students will calculate prices of items on sale, figure out the best deals and solve percentage-off problems.
Curated OER
Quinoa Pasta 2
Learners discover that a system of linear equations models this mixture of quinoa and corn in a collaborative task. Your learners receive all the relevant information in this second of three variants of tasks that ask them to find the...
Curated OER
Waters of the Earth
Students make a striking visual display showing the distribution of water on earth.
Discovery Education
Understanding Probability
Young scholars investigate probability. They will define probability as the likelihood of an event occurring. Then, they determine the probability of sitting in a particular seat on a plane. They also set up ratios of various seating...
McGraw Hill
Vocabulary Power
Augment your language arts units with a set of vocabulary worksheets. The packet is an excellent support to your vocabulary instruction that covers a variety of skills, including context clues, Greek and Latin roots, reference materials,...
Curated OER
Voter Turnout
Explore politics by analyzing the voting process. Pupils discuss the purpose of casting votes in an election, then examine graphs based on the data from a previously held election's turnout. The lesson concludes as they answer study...
EngageNY
Percent of a Quantity
Visualize methods of finding percents. Classmates find a percent of a quantity using two methods including a visual model in the 26th lesson in a series of 29. By the end of the lesson, scholars find percents given a part and the whole...
Curated OER
The Microwave and the Jiffy Store
Young historians examine the lifestyle changes and cultural changes that occurred as a result of the challenges posed by World War II on society in general. With regard to American History and culture, pupils write an essay on the...
Curated OER
Mathematics & Nutrition
Students apply math to calculate fat and calories in the food they eat. They examine food package information to become aware of the ingredients and to learn about healthy life styles. They work in groups to create crazy meals using the...
Curated OER
From There To Here...
Students find out where some of the products in hour homes come from, then become aware of our local trash, landfills and incinerators. They chart and graph data and use maps for different purposes.
National External Diploma Program Council
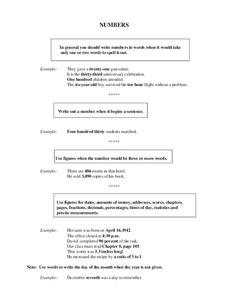
Numbers
The written form for 345 is three-hundred forty-five, where as the word form for 70% is seventy percent. Here, young mathematicians read 10 sentences and write the word form of each number in the sentences.
Curated OER
Latinos in the United States of America
Pupils explore a website about Latinos in the U.S., and answer worksheet questions about information on the website. They create a puppet show, organize a press conference, or create a brochure regarding Latinos living in the U.S.
Curated OER
The Price is Right
Students, through various activities, explore online databases. Using the internet, students explore the distributors websites. They collect specific information on selected products. An spreadsheet with price comparisons is developed....


