Curated OER
Functions and Their Graphs
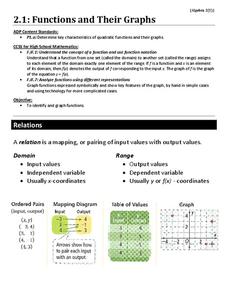
Use a worksheet to go over the basic concepts of relations and functions. Included are clear definitions and examples of relations, domain and range, and functions and the vertical line test. However, the problems are pretty...
Curated OER
Similarities and Differences in Properties of Different Families of Functions - An Investigation
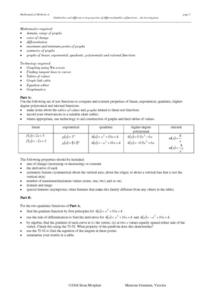
Exploring families of functions allows students compare and contrast properties of functions. Students discuss properties that include symmetry, max and min points, asymptotes, derivatives, etc.
Curated OER
Definition of a Function
Get those kids to solve and graph 10 different problems that include various types of functions and their relations. They determine if each graph represented is the relation of a function then determine which value of the variable will...
Curated OER
Calculus 30 - Typical Exam Questions
In this limits and functions worksheet, students solve 30 short answer questions about calculus Students find limits, domain, range, tangent lines, derivatives, and composition functions.
Charanga
Sing!
Whether new to the Kodály Method of music instruction or an experienced veteran, you'll find much to make your heart sing in a teacher guide that was designed for a music appreciation project.
Curated OER
Functions and Graphs, Section 1.2
In this function worksheet, pupils determine if a list of given relations is a function. They evaluate functions, examine graphs of functions, and find the domain and range of the represented function. Students solve 12 function problems...
Curated OER
Graphing
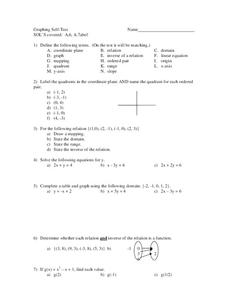
In this graphing worksheet, 9th graders solve and graph 8 different problems that include defining various terms related to graphing. First, they label the quadrants in a coordinate plane and name the quadrant for each listed ordered...
Mathematics Vision Project
Quadratic Functions
Inquiry-based learning and investigations form the basis of a deep understanding of quadratic functions in a very thorough unit plan. Learners develop recursive and closed methods for representing real-life situations,...
Education Development Center
Creating Data Sets from Statistical Measures
Explore the measures of central tendency through a challenging task. Given values for the mean, median, mode, and range, collaborative groups create a set of data that would produce those values. They then critique other answers and...
Mathematics Assessment Project
Statistics and Probability
Quickly assess basic understandings of statistics and probability. The resource contains five quick tasks from the probability and statistics domain. The questions range from finding simple conditional probabilities to measures of...
Flipped Math
Graphs of Functions
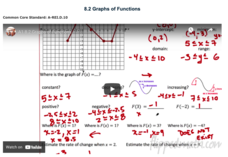
Create a graphical description. Pupils watch a video presentation starting with vocabulary on properties of a graph of a function and then use the vocabulary to find key features of graphs of a function. Scholars use three graphs in the...
Curated OER
Graphing Radicals
In this algebra worksheet, students find the domain and range of radical functions. They are given an equation and asked to graph the function. There are 14 questions on this worksheet, with an answer key.
Curated OER
Application of Function Composition
Young mathematicians solve composition of functions. They add, subtract, multiply and divide functions and then identify the domain and range of each function. An embedded animation shows three different applications of function...
Curated OER
Exercise Set 1.5: Inverse Functions
In this inverse functions worksheet, students review inverse functions. They solve 66 questions. Problems cover a wide variety of types. Students graph functions and their inverses, they identify one-to-one functions and the domains and...
Curated OER
Linear Functions
In this algebra learning exercise, students identify and label functions as linear or not. They find the domain and range of each function. There are 15 multiple choice questions.
Curated OER
Intermediate Algebra Worksheet 2.6
In this intermediate algebra activity, students solve logarithms, write equations in exponential, logarithm, and exponential form.. They find the sum and difference of logarithms and solve answers to three decimal places.
Curated OER
Chapter 7 Review: Radical Notation
For this radical notation worksheet, students write expressions using rational exponent notation and evaluate expressions with radical notation. They find the inverse of a function and give the domain. This three-page worksheet contains...
Curated OER
Finding My Pathway
Eighth graders engage in a lesson that is concerned with the acquiring of skills necessary to make informed career choices. They examine the type of language that should be acquired for communication in the workplace. They also have...
Curated OER
Functions
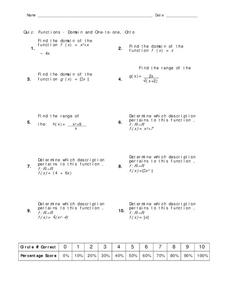
In this functions learning exercise, 11th graders solve 10 different problems that include various functions of domain. First, they determine the domain of a given function. Then, students determine the range of another function. They...
Curated OER
Inverse Functions 8-8
In this inverse function worksheet, students find the inverse function of given values. This two-page worksheet contains 12 multi-step problems.
Curated OER
Inverse Functions
In this inverse functions activity, students find the inverse of each given function. This one-page activity contains 3 problems.
Curated OER
Functions/Domain
Learners differentiate their problems to find functions and non-functions. In this calculus instructional activity, students relate functions and relation through similarities and differences. They rewrite equations that are...
Curated OER
Rational Functions
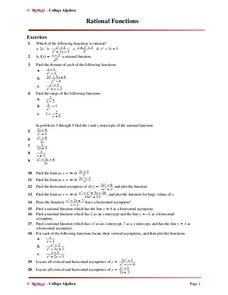
In this rational functions worksheet, students identify rational functions. They find the domain and range of each function. Students find the x and y-intercepts of functions. This two-page worksheet contains 35...
Curated OER
Graphic Designing with Transformed Functions
Teach your class how to transform a graph! By identifying the domain and range of the functions, students can observe the parabola and find the vertex of the transformed graph.


