Curated OER
The Ups and Downs of the Stock Market
This is a one-page worksheet in which students practice working out the percentage changes in the stock prices of major corporations such as Sears, etc. This is useful in a business or economics lesson.
Curated OER
Majority Rules
Students practice the voting process by taking a group vote using fractions or percents. In this voting process lesson, students review the voting process and vote using hands or a private ballot. Students tally the responses to the vote...
Curated OER
Molarity, Excess and Percent Yield
In this molarity worksheet, students are given balanced equations and they are to calculate the mass or volume of reactants and products. Students calculate the theoretical, percentage, and actual yield for chemical equations. This...
Curated OER
Finding Patterns in Fractals
Pupils discover patterns and sequences. They use a website to explore patterns and fractals. Students share their discovery of fractals and their patterns with the class. They develop a list of patterns used in everyday life.
Curated OER
"My Little Sister Ate One Hare" by Bill Grossman
Students understand, use, and compute basic probability.
Curated OER
Shadowing a Musher For Nine Days
Seventh graders follow and record the progress of a musher on the Iditarod race. They access the official Iditarod website, determine the musher's overall speed, the daily average temperature and daily hours of sunlight, and develop a...
Mathematics Assessment Project
College and Career Readiness Mathematics Test A1
A six-page test covers content from several different high school math courses. It incorporates a few short answer, graphing, and word problems. It also allows room for mathematical reasoning and analysis.
Inside Mathematics
Graphs (2007)
Challenge the class to utilize their knowledge of linear and quadratic functions to determine the intersection of the parent quadratic graph and linear proportional graphs. Using the pattern for the solutions, individuals develop a...
EngageNY
Decimal Expansions of Fractions, Part 1
Is it possible to add infinitely long decimals? As pupils complete the examples in the ninth lesson of this 25-part series, they determine that adding these decimals cannot be done without error. Their task is then to determine the size...
Bowland
Explorers – Patrol Services
Far out — plan a trip to space! Aspiring mathematicians steer a space vehicle through an asteroid field, calculate currency exchanges to buy provisions, and determine placement of charges to blow up asteroids. Along the way, they learn...
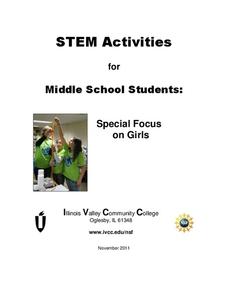
Illinois Valley Community College
STEM Activities for Middle School Students
Use STEM activities within the class to provide connections to concepts. The resource includes activities that range from working with buoyancy to building rockets and launching them. Other activities involve the engineering design...
Bowland
Bunting
How much fabric is necessary for bunting? Scholars use given dimensions of triangular bunting (hanging decorations) to determine the amount of fabric necessary to decorate a rectangular garden. The task requires pupils to consider how...
Bowland
Public Transport
"Statistics is the grammar of science" -Karl Pearson. In the assessment task, learners read a claim made by a newspaper and analyze its conclusions. They need to think about the sample and the wording of the given statistics.
Curated OER
Experimental Probability
While just a simple lesson, this activity on experimental probability could provide a way to connect this concept to real life. Learners begin by participating in a probability activity using a coin, and then move on to create their own...
Mt. San Antonio Collage
Quadratic Equations and Their Applications
Show high schoolers there is more to quadratic functions than just formulas and parabolas. Connect the math to realistic application problems with a resource that has learners consider such situations as a ball hit in the air, the...
Global Oneness Project
A Collapsing City Skyline
Have your high schoolers learn about the modern history of Myanmar by close-reading an article about the city and people of the city Yangon. As they'll learn, the country is going through some dramatic transitions. After reading the...
Global Oneness Project
Freedom to Change
Here's something unusual and thoughtful: have your scholars do some pensive reflection themselves before tackling how such meditative techniques are used in prison rehabilitation programs. They watch the "Path of Freedom" video found...
Curated OER
Build a Skittles Graph
Students construct a bar graph with a given set of data. They calculate the ratio and percent of the data. Students discuss alternate ways of graphing the data as well as multiple strategies to approach the task.
Math Mammoth
Circle
For this circle worksheet, students find the area and circumference of circles and compare their size using percents. Students determine the are of composite figures made of circles and rectangles. This one-page worksheet contains six...
Curated OER
How to Convert Percentages to Fractions and Decimals
Students can learn how to convert percents to decimals and fractions using 10x10 grids.
Curated OER
Time Management
Students plot activities for a 24 hour day. They record their information on a spread sheet program. Students list categories they use and write equations for cells that add cells of each category together. Students create a pie chart of...
Curated OER
Grade Expectations
Students explore how the ten percent plan and other education initiatives promote diversity, as well as about their practical effects on students from different types of educational and economic backgrounds. They discuss college...
Curated OER
Dripping Wet or Dry as a Bone?
Young scholars use a sponge and water model to explore the concept of relative humidity and create a percent scale. They define humidity and saturation, build a simple humidity/saturation model, collect, predict and interpret data, and...
Texas Instruments
Math TODAY for TI-Navigator System - Is Leisure Time Really Shrinking?
High schoolers organize data from the USA TODAY Snapshot, "Is leisure time really shrinking?" into two scatter plots and determine the quadratic model for each scatter plot. They determine if these graphs intersect and learn the concept...


