Curated OER
Car Activities
In this math worksheet, students find cars in Auto Trader. They find the difference between the prices of the cheapest and most expensive cars. Students select a car they like and follow directions to buy on credit. Students complete a...
Curated OER
Exponential Population Growth
In this exponential population growth activity, students read word problems and determine the exponential growth of a specified populations. They find the percent of growth and compute exponential regressions. Students graph...
Curated OER
Aboriginal Statistics
Fourth graders analyze statistics of Native Americans by creating graphs. In this data analysis lesson plan, 4th graders define different statistical terms and practice finding those statistics from groups of numerical information about...
Curated OER
Proportional Reasoning
In this proportional reasoning worksheet, students use proportions to solve discount and sale problems. This two-page worksheet contains 4 multi-step problems.
Curated OER
6th Grade Math Worksheet
In this multiple task math activity, 6th graders solve 10 math problems involving metric units, number lines, composite numbers, estimation and percentages.
Curated OER
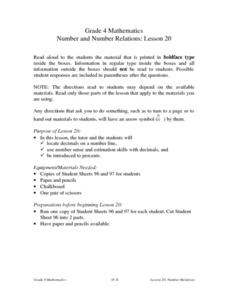
Number and Number Relations: Lesson 20
Fourth graders locate decimals on a number line. They use number sense and estimation skills with decimals. Students are introduced to percents. They look at fractions on a number line. Students fold a piece of paper to find halves,...
Curated OER
Percent Equations
In this percent equations activity, 6th graders solve and complete 9 different types of problems. First, they find the value of each percentage provided. Then, students determine the percentage of a given number.
Curated OER
Coal Supply and Demand
A hands-on simulation perfect for an economics lesson, young learners investigate the availability of different sources of natural energy (coal, natural gas, oil, solar, and nuclear) and how this availability affects their cost. Simulate...
Curated OER
Birds, Fractions and Percentages
Students study fractions, percentages, spreadsheets, and computers by watching and recording the number of species of birdsseen. They create a spreadsheet to record the results of their one month study.
Yummy Math
Valentine’s Day = Roses
Roses are red, but did you know that some are lighter while others are darker? Scholars read an infographic to decipher the fraction and percent of rose color and their country of origin. They go on to make comparisons and estimate while...
CCSS Math Activities
Sandwich Shop
Eat up the task on systems of equations. Given information on the total number of sandwiches and the total income, learners write and solve a linear system of equations to find the number of each type of sandwich sold at a shop. They...
Willow Tree
Simple Probability
The probability of learning from this instructional activity is high! Learners calculate probabilities as numbers and as decimals. They see how to use a complement to find a probability and even try a simple geometric probability problem.
Houghton Mifflin Harcourt
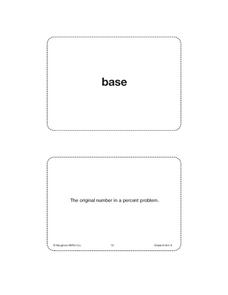
Unit 6 Math Vocabulary Cards (Grade 6)
Fifty-eight flashcards make up a set designed to reinforce math vocabulary. Within the set, you'll find bold-faced word cards as well as definition cards that offer a labeled example. Terms include base, percent, theoretical probability,...
Willow Tree
Circle Graphs
Pie isn't just for eating! Scholars learn to create pie charts and circle graphs to represent data. Given raw data, learners determine the percent of the whole for each category and then figure out the degree of the circle that percent...
Kentucky Adult Education
Probability Lesson Plan
Roll the dice with this multimedia math lesson on probability. After first viewing a series of three short videos explaining probability, independent events, and dependent events, young mathematicians complete a set of practice...
Math Worksheets Land
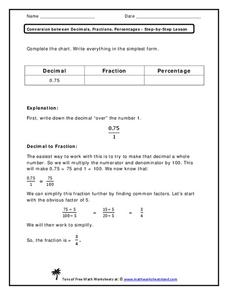
Conversion between Decimals, Fractions, Percentages - Step-By-Step Lesson
A helpful math worksheet, intended as a guided lesson, walks young mathematicians through the process of converting the decimal 0.75 to a fraction and percent.
Balanced Assessment
Stock Market
Analyze trends in the stock market using histograms. Future economists use data presented in a histogram to find periods of greatest increase and decrease. They also draw conclusions about days that would be best to invest.
Kenan Fellows
Isotopic Pennies
Many people confuse atomic mass and atomic numbers. The sixth of seven lessons in a unit requires scholars to find the weight of different groups of pennies. Then, they must solve how many of each type of penny exists in a closed system...
Mathed Up!
Fractions of an Amount
After viewing a video on fractional amounts, young mathematicians put their new knowledge to the test. Throughout the assessment, class members find the fractional amount for prices, times, and populations. There are a few percent and...
Mathematics Assessment Project
Ratios and Proportional Relationships
Time to see what they've learned. Seventh graders solve a set of seven short problems in the ratios and proportional relationships domain. Applications include photo negatives, washing machines, coffee powder, sleep, stamps, etc.
Mathematics Assessment Project
Middle School Mathematics Test 6
A thorough math test divides the content into two 40-minutes sections, covering material through algebra and geometry. Problems incorporate analysis and applied problem solving.
Santa Monica College
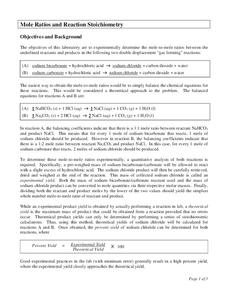
Mole Ratios and Reaction Stoichiometry
Stoichiometry sounds complicated, but it really means the study of the amount of substances involved in a reaction. The sixth lesson plan in an 11-part series has scholars use stoichiometry to find the theoretical yield of a reaction....
EngageNY
Margin of Error When Estimating a Population Proportion (part 2)
Error does not mean something went wrong! Learners complete a problem from beginning to end using concepts developed throughout the last five lessons. They begin with a set of data, determine a population proportion, analyze their result...


