Curated OER
Standard Sizes of Paper
Young scholars measure the dimensions of different sizes of paper. Using a copy machine, they discover dilations. After enlarging and shrinking particular copies, students examine rates, ratios and percentages and discover the...
Curated OER
Time Management
Learners plot activities for a 24 hour day. They record their information on a spread sheet program. Students list categories they use and write equations for cells that add cells of each category together. Learners create a pie chart of...
Curated OER
Let's Make Fudge
Students make fudge after reading fractional values in recipes and finding equivalent fractions to those presented in the recipes. They study measurement abbreviations.
Curated OER
Pigs, Pigs, Pigs!
Third graders find information about different breeds of pigs using the Internet, books, and encyclopedias. Groups select one breed of pig that interests them. They construct a stuffed likeness of the pig.
Curated OER
Baseball Statistics
Students take an in depth examine baseball record breakers. They calculate statistics, not just for one year, but over whole careers, to compare some famous players and find who was the best all-time home run hitter.
Curated OER
Radioactive Dating
For this radioactive dating worksheet, students use their reference guide in their text book to find the half-lives of 4 isotopes. They use a decay chart to help determine the half-lives and age of given bones and samples of radioactive...
Curated OER
Fuel Saving
Young scholars explore the problem of percentages. Students find a given fraction or percentage of a quantity. Young scholars devise and use problem solving strategies on problems explored.
Curated OER
Percentages
For this percentages worksheet, 5th graders solve and complete 3 different problems. First, they complete the table shown with the correct fraction, decimal and percentage. Then, students find the percentage of each given number.
Curated OER
Fractions
In this fractions worksheet, students solve and complete 3 different types of problems. First, they complete the table shown with the correct percentage, fraction or decimal. Then, students find the measurements shown. In addition, they...
Todd Bowden
Number Line
Arrange these in order on a number line:
95%
1/3
.700
3/5
5/6
50%
.200
Was that too easy? Don't worry! This app gradually gets more difficult.
Northeastern Educational Television of Ohio, Inc.
Roman World vs. Feudal World
Young historians compare the major features of the Roman and feudal worlds, such as religion, social hierarchy, and political tenets, using online resources and group discussion.
Inside Mathematics
Conference Tables
Pupils analyze a pattern of conference tables to determine the number of tables needed and the number of people that can be seated for a given size. Individuals develop general formulas for the two growing number patterns and...
Inside Mathematics
Two Solutions
Many problems in life have more than one possible solution, and the same is true for advanced mathematics. Scholars solve seven problems that all have at least two solutions. Then three higher-level thinking questions challenge them to...
Illustrative Mathematics
Accuracy of Carbon 14 Dating II
The scientific issue of carbon-14 dating and exponential decay gets a statistics-based treatment in this problem. The class starts with a basic investigation of carbon content, but then branches out to questions of accuracy and...
Social Media Toolbox
Twitter Time
Tweet all about it! Junior journalists explore the Twittersphere to determine its effectiveness as a news broadcasting tool in the 12th installment of the 16-part Social Media Toolbox. Participants follow and record their observations of...
Noyce Foundation
Pizza Crusts
Enough stuffed crust to go around. Pupils calculate the area and perimeter of a variety of pizza shapes, including rectangular and circular. Individuals design rectangular pizzas with a given area to maximize the amount of crust and do...
Inside Mathematics
Graphs (2006)
When told to describe a line, do your pupils list its color, length, and which side is high or low? Use a worksheet that engages scholars to properly label line graphs. It then requests two applied reasoning answers.
Inside Mathematics
Graphs (2007)
Challenge the class to utilize their knowledge of linear and quadratic functions to determine the intersection of the parent quadratic graph and linear proportional graphs. Using the pattern for the solutions, individuals develop a...
Helping with Math
Ratio and Proportion: Simplifying Ratios (1 of 2)
Here is a set of 24 pairs of numbers for which kids reduce the ratios to their simplest form. It is a simple and straightforward assignment, meant by the publisher to address CCSS.Math.Content.6.RP.3. Note, however, that it only requires...
Curated OER
Venn Diagrams & Word Problems
Students explore the concept of Venn Diagrams through word problems. In this Venn Diagram lesson, students solve word problems about groups of people using Venn Diagrams. Students use survey results about MySpace and Facebook in a Venn...
Curated OER
Bargain Town, USA
Third graders discuss discounts and walk around classroom labeled with lots of discounted merchandise. They complete a worksheet converting original prices to new bargain prices.
Curated OER
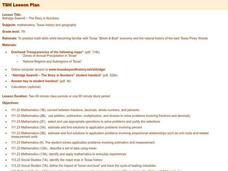
Aldridge Sawmill - The Story in Numbers
Seventh graders view overhead maps of Texas, explore history of Aldrige Sawmill, and practice math skills while becoming familiar with Texas' "Boom & Bust" economy and natural history of east Texas Piney Woods.
Curated OER
Aldridge Sawmill - The Story in Numbers
Seventh graders practice math skills while becoming familiar with Texas' "Boom & Bust" economy and the natural history of the east Texas Piney Woods. They utilize worksheets and websites imbedded in this plan.
Curated OER
Comparing Ratios
For this comparing ratios worksheet, students solve and complete 3 different problems using the screens shown. First, they write a ratio that compares the shaded part to unshaded part illustrated. Then, students use the same grid to...


