Flipped Math
Correlation
Determine how close the line is to the scatter plot. Clear video instruction shows how to plot a scatter plot and find the best fit line using the linear regression function on a calculator. Pupils use the information from the calculator...
Curated OER
Topic 2.3 - Slope
In this slope intercept worksheet, students solve 15 problems in which they find the slope of a linear equation, the slope of a graph, the slope using 2 points, and the equation of a line parallel or perpendicular to a given line.
Curated OER
An Exploration of the Slope of a Line
Students define the slope of a line. For this algebra lesson, students differentiate between parallel and perpendicular lines using their slopes. They rewrite equations in slope intercept form and explain the meaning of the slope.
Curated OER
Lines of Slope
In this lines of slope worksheet, 9th graders solve and complete 40 various types of problems. First, they find the equation of the lines described and write in slope-intercept form. Then, students graph each equation. They also find the...
Curated OER
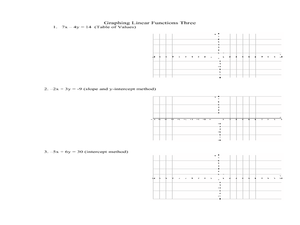
Graphing Linear Functions Three
In this algebra worksheet, students are given an equation and asked to create a table of values and graph their equation. The other method they use for graphing is the slope intercept method, by solving the equation for y and identifying...
Curated OER
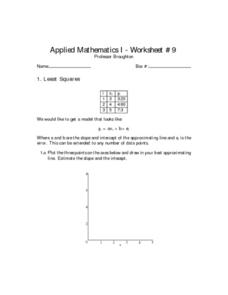
Least Squares
In this least squares worksheet, students solve 6 different problems that include the least squares of numbers. First, they plot 3 points on the axes shown and draw in their best approximating line. Then, students estimate the slope and...
Curated OER
Chapter 2.4 - Writing Linear Equations
In this slope-intercept worksheet, students solve 18 problems in which they find the slope-intercept and y-intercept of a graph given an equation, find the equation given a point and the slope-intercept, and find the equation of a...
Curated OER
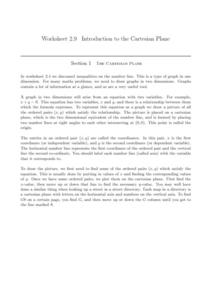
The Cartesian Plane
Learners solve and complete 22 various types of problems. First, they find the gradients of the lines and plot the given points. Then, they complete the table of values for each equation and use the table to draw the graph.
Willow Tree
Linear Relationships
There's just something special about lines in algebra. Introduce your classes to linear equations by analyzing the linear relationship. Young mathematicians use input/output pairs to determine the slope and the slope-intercept formula to...
K20 LEARN
Airplanes and Airstrips, Part 2
Table the decision to land. Pupils form flight crews by matching up different representations of linear equations. Given a set of coordinates for an airstrip, the crews determine the equation of the line that will position their planes...
Illustrative Mathematics
DVD Profits, Variation 1
The idea in the resource is to understand the connections between proportional relationships, lines, and linear equations. To stay within the context of the standard, skip the part of the resource that solves with unit rates. Instead,...
Curated OER
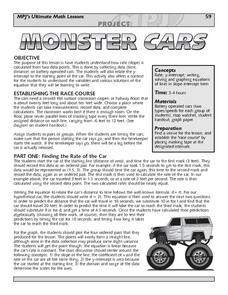
Monster Cars: Slope
Students examine how a rate is calculated from two points. Using battery operated cars, pairs of students measure time and distance. Afterward, they use this data to calculate the rate. Students then plot four ordered pairs and discover...
Curated OER
Standard Linear Form
Ninth graders identify and describe the x-intercept as the place where the line crosses the x-axis as it applies to football. They create their own differentiations to reinforce the distinction between the x-intercept and the...
Curated OER
Pairs of Lines Multiple Choice
In this algebra worksheet, students identify the slope and y intercept of lines. They compare the slope of perpendicular and parallel lines and find the missing slope. There are 6 questions with an answer key.
Curated OER
Two-Variable Linear Inequalities
Here is an engaging lesson on solving equations with two variables. Have the class rewrite linear equations in the slope intercept form, y=mx + b. They graph the lines using the slope and y-intercepts.
Curated OER
Cockroach Slope
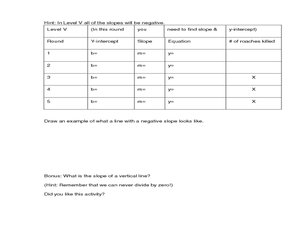
Students identify the slope of linear functions. In this slope lesson, students collect data and graph it. They write equations with no more than two variables and use technology to explain their data.
Curated OER
Slopes, Slope-Intercept Form, Standard Form
Students identify the slope of an equation using various methods. In this algebra lesson, students graph linear equations and calculate the slopes using the x and y intercept to solve the equations and graph the lines. They use the slope...
Curated OER
Introduction to Differentiation
In this introduction to differentiation learning exercise, students solve and complete 10 various types of problems. First, they use the definition of differentiation to evaluate the derivative of the functions listed. Then, students...
Curated OER
Writing and Graphing Linear Equations on a Flat Surface
In this linear equations worksheet, students write the equation of a line with given characteristics. They identify the slope of a line and the y-intercept. Explanations and examples are provided at the beginning of the worksheet. This...
Mathematics Vision Project
Module 1: Getting Ready Module
This fabulous resource is a must-have for any algebra teacher's arsenal of lessons. Developing the idea of equations and use of variables from basic physical scenarios, learners gain valuable intuition in the structure and meaning of...
Alabama Learning Exchange
Human Slope
Middle and high schoolers explore the concept of slope. In this slope lesson, learners graph lines using a life-size graph. They use chalk on a blacktop to create a coordinate plane and use each other as the tick marks on the grid....
Curated OER
Linear Modelling of the Life Expectancy of Canadians
Middle and high schoolers explore the concept of linear modelling. In this linear modelling instructional activity, pupils find the line of best fit for life expectancy data of Canadians. They compare life expectancies of men and women,...
Curated OER
Parallel and Perpendicular Lines
Young geometers get some solid skills practice in evaluating slopes. Beginning with the basics of slope through two points and progressing through properties of parallel and perpendicular lines, the building of skills is gradual and...
Curated OER
Is there Treasure in Trash?
More people, more garbage! Young environmentalists graph population growth against the amount of garbage generated per year and find a linear model that best fits the data. This is an older resource that could benefit from more recent...


