Virginia Department of Education
z-Scores
Just how far away from the mean is the data point? Pupils calculate the standard deviation for a set of data and find out how many standard deviations a point is away from the mean. The teacher leads a discussion on how to calculate...
Curated OER
Z-Scores related to Psychology
In this z-score learning exercise, students identify the z-scores and percentiles corresponding to thirteen values. Students are also asked to find two probabilities. Worked solutions are provided after each question.
Curated OER
Z-Scores
Learners solve problems by identifying the percent of area under the curve. In this statistics lesson, students discuss z-scores as they calculate the different percentages under the bell curve. They calculate the standard deviation.
Virginia Department of Education
Organizing Topic: Data Analysis
Learners engage in six activities to lead them through the process of conducting a thorough analysis of data. Pupils work with calculating standard deviations and z-scores, finding the area under a normal curve, and sampling...
Virginia Department of Education
Normal Distributions
Pupils work to find probabilities by using areas under the normal curve. Groups work to calculate z-scores and solve real-world problems using the empirical rule or tables.
Radford University
What Is Normal?
Are you taller than a Major League Baseball player? Future mathematicians learn about normal distributions, percentiles, z-scores, and areas under a normal curve. They use the concepts to analyze height data of Major League Baseball...
Curated OER
Two-sided Confidence Interval for a Population Proportion
In this two-sided confidence interval worksheet, students solve 3 problems to include constructing a confidence interval for a population proportion with a large sample. First, they split the confidence and shad its cumulative are for a...
Illustrative Mathematics
SAT Scores
If you earned a score of 610 on the math portion of the SAT, what would be your percentile ranking? Given the mean and standard deviation of normally distributed data, find the probability of getting a particular score, or that your...
EngageNY
Normal Distributions (part 2)
From z-scores to probability. Learners put together the concepts from the previous lessons to determine the probability of a given range of outcomes. They make predictions and interpret them in the context of the problem.
Virginia Department of Education
Calculating Measures of Dispersion
Double the fun — calculate two measures of deviation. The lesson plan provides information to lead the class through the process of calculating the mean absolute deviation and the standard deviation of a data set. After learning how to...
Curated OER
Practice Problems: Standard Scores
In this standard scores worksheet, students find the percentile rank of given numbers. This one-page worksheet contains 8 problems. Answers are provided.
Illustrative Mathematics
Should We Send Out a Certificate?
Fred thinks his test score is high enough to earn him a certificate. Given the mean and standard deviation, use properties of normal distributions to calculate Fred's percentile ranking and see if he is right. Consider having your class...
Virginia Department of Education
Exploring Statistics
Collect and analyze data to find out something interesting about classmates. Groups devise a statistical question and collect data from their group members. Individuals then create a display of their data and calculate descriptive...
Curated OER
SAT Grid Ins Practice Test 09
In this SAT practice worksheet, learners solve 10 grid in problems. Students find surface area, slope, mean, factors, etc.
Curated OER
Geometric Figures
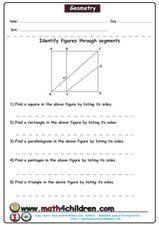
In this identifying figures through segments worksheet, students find a square, rectangle, parallelogram, pentagon, and triangle by listing their sides in a large figure. Students solve five problems.
Inside Mathematics
Magic Squares
Prompt scholars to complete a magic square using only variables. Then they can attempt to solve a numerical magic square using algebra.
Curated OER
Geometry - Complex Figure
For this geometry worksheet, 4th graders work with a complex figure. They calculate the length of one line in the figure, find the perimeter, the length of another side, and the surface area of the figure.
Curated OER
Complex Figures
In this complex figure worksheet, students find the length, height, perimeter, and surface area of the complex figure. Students complete 4 problems.
Curated OER
Geometry: Identify Figures Through Segments
In this geometry worksheet, learners answer 5 questions, finding shapes using a figure with labeled line segments running through it. A reference website is given for additional resources.
Curated OER
Transforming Univariate Data
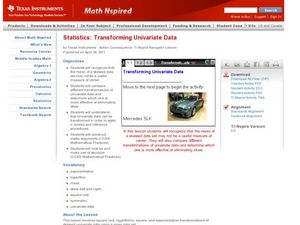
Learners analyze plotted data in this statistics activity. They differentiate between skewed and normal data. They also explore and interconnect exponential growth and decay as it relates to the data.
Curated OER
Confidence Intervals: Population Mean; Population standard Deviation Known
In this confidence interval worksheet, students examine a given confidence level and sample data to determine the margin of error, identify a confidence interval, list the mean and give the standard deviation. Students complete seven...
Curated OER
Quiz: Subtraction Principle
In this subtraction principle worksheet, students solve algebraic equations containing one or two variables. This one-page worksheet contains 20 problems.
Khan Academy
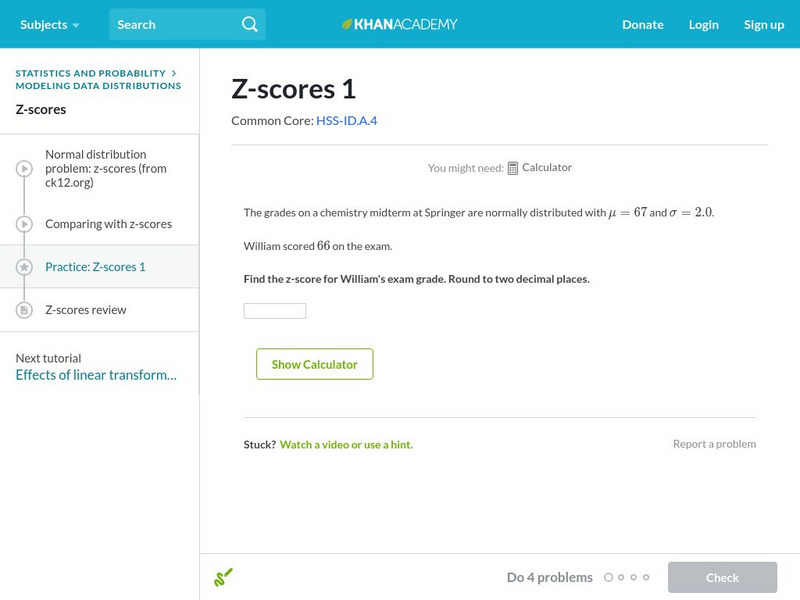
Khan Academy: Z Scores 1
Find the z-score of a particular measurement given the mean and standard deviation. Students receive immediate feedback and have the opportunity to try questions repeatedly, watch a video or receive hints.
Other
Fayetteville State University: Z Distributions
The introductory paragraph explains Z-Distributions, their spread, and the ability to find certain values within the distribution. Two animated graphs are then provided as an example of the probability of the normal distribution curve.


