Curated OER
Matrix Operations
Students solve problems using matrices. In this algebra lesson, students add, subtract and multiply matrices. They use the graphing calculator to simplify and graph linear equations.
Curated OER
Model Data with Quadratic Functions
Students model data using quadratic equations. In this algebra lesson, students simplify and factor quadratic equations. They graph the function using collected data and analyze the parabola.
Curated OER
Tackling Mean - Median and Mode
Second graders wear a favorite sports jersey to school. They calculate the mean, median and mode of the numbers represented on the jerseys. They present and explain their calculations to the class.
Curated OER
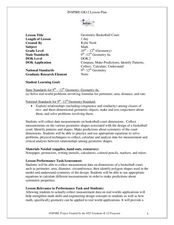
Geometric Basketball Court
Students calculate the area and perimeter of a basketball court. In this geometry lesson, students differentiate between similarity and congruence of geometric objects. They test conjectures and use it to solve problems.
Curated OER
Determine the Coordinate of Transformations
Learners investigate transformation on a coordinate plane. In this geometry lesson, students identify pairs of coordinates and their location on the grid. They perform rotation and reflection of each polygon.
Curated OER
Mr. Cobbler's Shoe Dilemma
Young scholars employ statistics to solve real-world problems. They collect, organize and describe data. They make inferences based on data analysis. They construct, read, and interpret tables, charts and graphs.
Curated OER
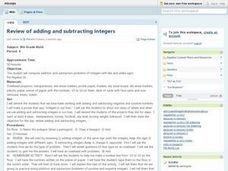
Review of Adding and Subtracting Integers
Eighth graders review adding and subtracting of integers. The class makes a number line from -10 to 10 and practice adding and subtracting by "acting out" the math problems. Students play a card game using the number cards from a regular...
Curated OER
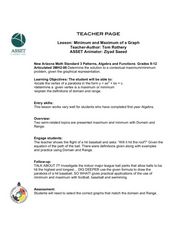
Minimum and Maximum of a Graph
Students find the solutions of polynomials through graphing. In this algebra lesson plan, students identify the maximum and minimum of each polynomial function. They ind the vertex, domain and range of a parabola.
Curated OER
Frequency Distributions and Measures of Central Tendency
Twelfth graders use the Internet to research information on NFL players and construct frequency distributions from the data. They calculate the mean, medium and analyze their data.
Curated OER
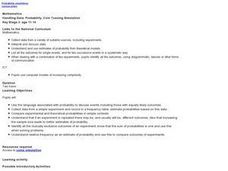
Handling Data: Coin Tossing Simulation
Students collect experimental data and record it on a frequency table. After accessing an Internet coin toss simulation site they discover that repetition of an experiment may result in different outcomes. They identify the mutually...
Curated OER
Integers
Young scholars multiply integers. In this multiplying integers lesson, students multiply positive and negative integers. Young scholars discuss that a positives times positives, positives times negatives, and negatives times...
Curated OER
A Budget Can Help Young People Cut Their Spending
Learners explore the concept of budgeting. In this budgeting lesson, students read an article about how a budget helps young adults keep track of their spending. Learners discuss financial issues that young adults have to deal with as...
Curated OER
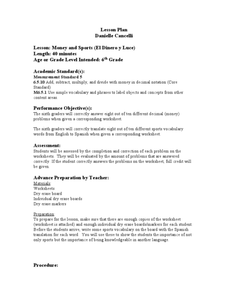
Money and Sports
Sixth graders translate sports vocabulary words from English to Spanish and complete money problems containing decimals. In this money and sports lesson plan, 6th graders use words to communicate to each other.
Curated OER
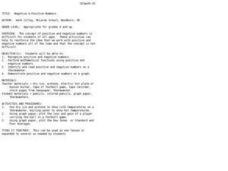
Negative & Positive Numbers
Students recognize positive and negative numbers and perform mathematical functions.
Curated OER
Introduction to Limits
Twelfth graders problem solve limit/function value situations. They solve the problems using a graphing calculator, which allows them to see the function's graph, and infer the function value and limit from the graph.
Curated OER
Fly Away With Averages
Young scholars study mean, median, and mode. They construct paper airplanes and test them to see how far they fly. They measure the distance and then find the averages of their throws. They use spreadsheet software to record the data...
Curated OER
Fly Away With Averages
Students discover the process of finding the mean, median, and mode. Through guided practice and problem solving activities, they use a computer program to input data and create a graph. Graph data is used to calculate the mean,...
Curated OER
Introduction to Descriptive Statistics
Pupils follow examples to study basic concepts of statistics. They work independently through the activities.
Curated OER
Unit 13: Graphs, Correlation, Line of Best Fit
Students explore the concepts of graphs, correlations, line of best fit, and the dipstick problem. For this graph, correlation, line of best fit and dipstick problem lesson, students solve problems on the above mentioned topics. ...
Curated OER
Parabolas in Flight
High schoolers utilize a trajectory formula in order to discover the physics of a thrown ball. In this physics lesson, students videotape the trajectory of a thrown ball or basketball shot and analyze the action by breaking the video...
Curated OER
Adding and Subtracting Integers
Sixth graders create electronic manipulatives to model addition and subtraction of integers. They are introduced to the software Inspiration and use techniques such as selecting and deselecting an object, resizing an object, moving an...
Curated OER
A Game of Chance
Students explore probability through cooperative group activities and interactive video technique.
Curated OER
Create a Full-Scale Layout of the International Space Station
Students work together to convert scale dimensions to determine the true size of the International Space Station. They create a full-scale outline of the station. They share their layout with the class.
Curated OER
Derivatives of Exponential Functions
Students take derivatives of exponential functions. In this taking derivatives of exponential functions lesson, students prove the derivative of an exponential function is the exponential function. Students find derivatives where the...
Other popular searches
- Football Math Statistics
- Football Math Number Line
- Football Math Worksheets
- Football Math Lessons
- Football Math Riddles
- Math Center Football
- Football Math Coordinate
- Fantasy Football Math
- Football Math Lesson Plan
- Football Math Superbowl
- Football Math Percentages
- Math Football


