Curated OER
Investigation - The M & M Mystery
Sixth graders inspect M&M's to complete statistical data. Students interpret percent of colors represented. They convert data from decimals, fractions, and percents. Using the data, 6th graders create a bar graph and a circle graph.
Curated OER
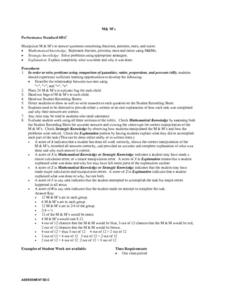
M&M's
Learners use M&M candies to show fractions, percents, and ratios. Individually, they complete a worksheet using their candies and solving equations of greater than or less than. They review their answers and strategies used as a...
Beyond Benign
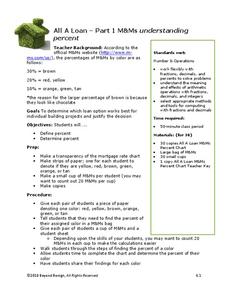
All A Loan
When designing a house, it's important to know about percents. Through a series of three lessons, scholars first review percentages through an activity involving M&Ms and then apply that knowledge to calculate compound interest and...
Curated OER
M&M Science and Math
A series of math and science activities feature M&M's® as manipulatives to help kids work through equations. The resource includes exercises on finding averages, percent of compositions, moles in chemical reactions, genotypes and...


