PBS
Pbs Learning Media: Restocking Shoes
In this video from Cyberchase, Bianca uses data on past shoe sales to help her decide what quantities of each size she should order in the next shipment.
Other
Online Statistics Education: Graphing Distributions [Pdf]
This is the second chapter of a statistics e-text developed collaboratively by Rice University, University of Houston Clear Lake, and Tufts University. It looks at many different types of data displays and the advantages and...
CK-12 Foundation
Ck 12: Types of Data Representation: Graphic Displays of Data
[Free Registration/Login may be required to access all resource tools.] Here you will explore displays of data using bar charts, histograms, pie charts and boxplots, and learn about the differences and similarities between them and how...
Richland Community College
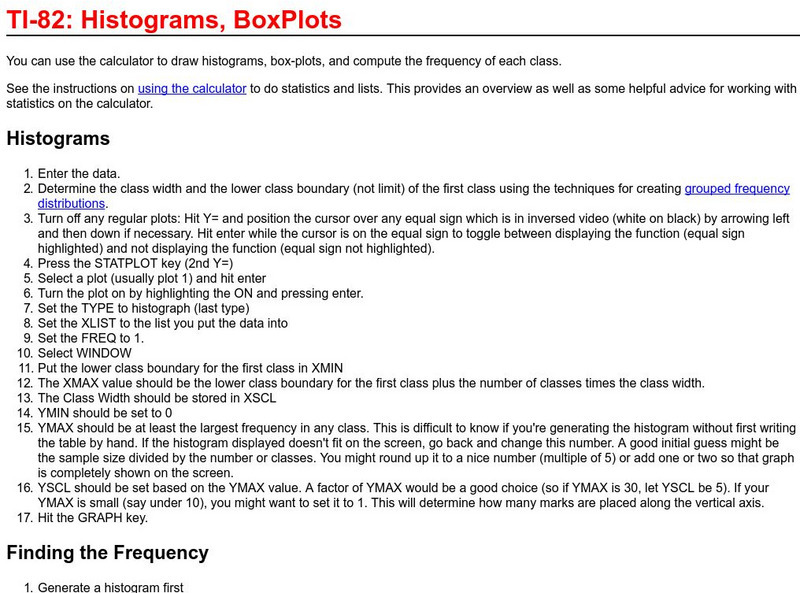
Richland College: Ti 82 Histograms / Box Plots
Richland College provides a step-by-step procedure on how to use a TI-82 to construct histograms and box plots and then use this to find frequency distribution.
Khan Academy
Khan Academy: Comparing Data Displays
Practice interpreting and comparing dot plots, histograms, and box plots. Students receive immediate feedback and have the opportunity to try questions repeatedly, watch a video or receive hints.
Oswego City School District
Regents Exam Prep Center: Displaying Data
Use this lesson, practice exercise, and teacher resource in planning instruction on displaying data. In the lessons, you'll find definitions and examples of ways to collect and organize data, quartiles, and box-and-whisker plots, as well...
Richland Community College
Richland Community College: Stats Graphs Defined
Richland Community College provides a glossary of many terms that are needed in order to understand statistics graphs and charts. Each of the types of charts is quickly explained in terms of what it is most effective in displaying.
Khan Academy
Khan Academy: Comparing Distributions
Practice comparing distributions that are presented in dot plots, histograms, and box plots. Students receive immediate feedback and have the opportunity to try questions repeatedly, watch a video or receive hints.
Other
Stat Soft: Statistics Glossary
Dozens of statistical terms are defined and illustrated in this glossary.
University of Georgia
University of Georgia: Definitions in Statistics
This site contains definitions to use in statistics and ways to collect data.
Oswego City School District
Regents Exam Prep Center: Categorizing Data
Three lessons on different types of data (qualitative, quantitative, univariate, bivariate, biased data) as well as a practice activity and teacher resource.
Purple Math
Purplemath: Stem and Leaf Plots
Explains how to create a stem-and-leaf plot from a data set. Demonstrates how to format a clear stem-and-leaf plot.
Science Buddies
Science Buddies: Dry Spells, Wet Spells: How Common Are They?
Here's a project that looks at what the weather was like for over a hundred years. The goal of the project is to compare long-term precipitation patterns in different regions of the country. You will work with historical climate data,...
Houghton Mifflin Harcourt
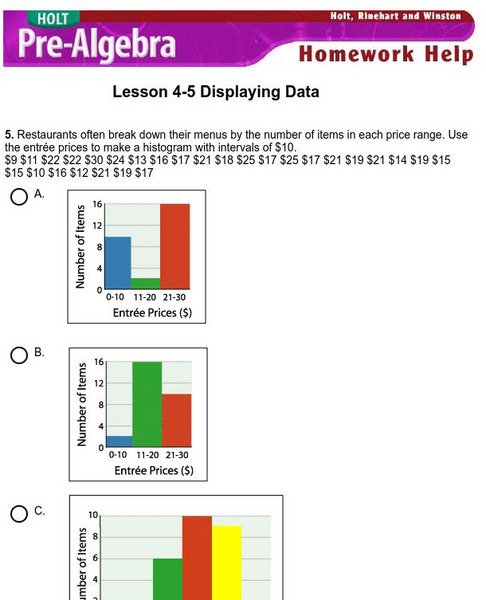
Holt, Rinehart and Winston: Homework Help Independent Practice: Displaying Data
Get independent practice displaying data. Each incorrect response gets a text box explanation and another try. Correct responses are confirmed.
Texas Instruments
Texas Instruments: Statistics for Math B
Students will determine the mean, median, mode and standard deviation of collected data. They will make a frequency histogram of the grouped data, both on graph paper, and on the TI 83+.


