Statistics Education Web
You Will Soon Analyze Categorical Data (Classifying Fortune Cookie Fortunes)
Would you rely on a fortune cookie for advice? The lesson first requires future statisticians to categorize 100 fortune cookie fortunes into four types: prophecy, advice, wisdom, and misc. The lesson goes on to have learners use...
MENSA Education & Research Foundation
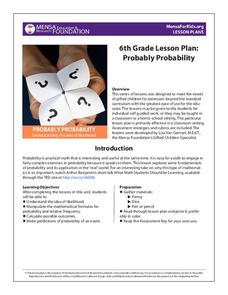
Probably Probability
Reinforce the concept of probability with a series of lessons highlighting the idea of likelihood, probability formulas, relative frequency, outcomes, and event predictions. The collection is made up of four lessons offering informative...
Howard Hughes Medical Institute
Patterns in the Distribution of Lactase Persistence
We all drink milk as babies, so why can't we all drink it as adults? Examine the trend in lactase production on the world-wide scale as science scholars analyze and interpret data. Groups create pie charts from the data, place them on a...
Houghton Mifflin Harcourt
All Together Now: Extra Support Lessons (Theme 1)
All Together Now is the theme of this series of extra support lessons. The collection aids the instruction of blending sounds and reading high-frequency words through writing and reading sentences. Support also engages pupils...
Houghton Mifflin Harcourt
Surprise!: Extra Support Lessons (Theme 2)
Surprise! is the theme of a unit covering such topics as consonants, blending, short vowels sounds, high frequency words, and number words. The unit's lessons also include teachable moments covering story structure, illustrations,...
Houghton Mifflin Harcourt
Family and Friends: English Language Development Lessons (Theme 4)
Family and Friends is the theme of a unit consisting of English language development lessons. Reinforce language proficiency, particularly in family vocabulary, basic needs, feelings, short vowel sounds, blending, reading high frequency...
Houghton Mifflin Harcourt
Family and Friends: Extra Support Lessons (Theme 4)
Family and Friends is the theme of a unit offering extra support lessons. Follow each lesson plan's teach, blend, guided practice or practice/apply routine to reinforce concepts such as clusters, responding to reading, drawing...
Houghton Mifflin Harcourt
Home Sweet Home: Extra Support Lessons (Theme 5)
Home Sweet Home is the theme of a unit comprised of extra support lessons. Scholars reinforce concepts through chants, grand discussions, and practice worksheets. Topics include digraphs, blending phoneme, long vowels, final sounds,...
Houghton Mifflin Harcourt
We Can Do It!: Extra Support Lessons (Theme 10)
Scholars participate in chants, grand discussions, and complete practice pages in a We Can Do It! themed unit. Designed to provide extra support, the assortment of lessons cover topics such as r-controlled vowels, comparatives...
Curated OER
Range, Cluster, Gap and Outliers
There are a number of activities here where learners collect and record data, as well as, activities where the likelihood of an event happening is calculated given the experimental probability. Young statisticians organize information...
Curated OER
Dot Plots
Number crunching statisticians explore displaying data with dot plots and define the difference between quantitative data and qualitative data. Dot plots are created based on a set of given data and analyzed.
College Board
2017 AP® Statistics Free-Response Questions
Reduce testing anxiety by helping learners prepare for test day. Scholars complete six free-response questions from a released AP® exam. The questions test a variety of concepts including confidence intervals, frequency tables,...
Curated OER
Statistical Calculations Using M&Ms
In this frequency instructional activity, students investigate, frequency, box plots, and percentage using a package of M&Ms. Copies of the actual correspondences with the Mars company are also included.
Curated OER
A Ststistical Study on the Letters of the Alphabet
In this Statistics and Probability learning exercise, students create a line plot for the first 100 letters in the Preamble to the constitution and compare their frequency distributions to the actual frequency distribution. The one...
Curated OER
Quiz: Central Tendency and Dispersion
In this central tendency and dispersion worksheet, students find the mean, median and mode of a set of numbers. The set of numbers is not included on this worksheet. They complete a frequency distribution and find the modal interval.
Curated OER
Central Tendency
In this central tendency instructional activity, 8th graders solve 10 different problems that include determining the mean, mode, and median of various situations. First, they prepare a frequency distribution with a class interval for...
Curated OER
The Distribution of Earthquakes
Students determine the rate of seismicity by determining the frequency of aftershocks following a major earthquake. They incorporate the use of the Internet, Excel 2000, a map of their area with latitude and longitude markers, and paper...
Wise Owl Factory
Happy Father's Day
Celebrate Father's Day this year with a fun math and coloring activity! After counting all of the dad-related pictures and graphing their frequency, learners color a Father's Day card to give to their dads.
Curated OER
Are Taxes "Normal?"
Students explore the concept of normal distribution. In this normal distribution lesson, students find the normal distribution of taxes in the 50 US states. Students make histograms, frequency tables, and find the mean and median of tax...
Inside Mathematics
Suzi's Company
The mean might not always be the best representation of the average. The assessment task has individuals determine the measures of center for the salaries of a company. They determine which of the three would be the best representation...
Shmoop
Box, Stem-Leaf, and Histogram
A helpful and versatile instructional activity requires young mathematicians to analyze data in order to create graphs and answer questions. Additionally, it prompts learners to find the mean, median, mode, and range of some of...
Curated OER
A Pocketful of Change
Students study the meaning, symbolism, and value of U.S. coins,
especially the quarter. They conduct a survey of coins in students'
possession, graphing the results to show frequency distribution and drawing
inferences about the U.S....
Inside Mathematics
Magic Squares
Prompt scholars to complete a magic square using only variables. Then they can attempt to solve a numerical magic square using algebra.
Curated OER
Integrated Algebra Practice: Histograms
In this histogram worksheet, students solve 6 multiple choice and short answer problems. Students read histograms and determine the frequency of a particular item.


