Curated OER
Breeding Bunnies
Students learn the impact that genetics can have on the evolution of a population of organisms and become aware of the influence that the environment has onorganisms.
Curated OER
Boxplots Introduction
Students describe the pattern of a bell curve graph. In this statistics lesson, students move data around and make observation about the mean, and the quartiles. They define boxplot, outlier, range and other important vocabulary words...
Curated OER
What is a P-value?
Students test the hypotheses using p values. In this statistics lesson, students define and examine conditional probability. They test each statement for a true statement or a false statement, based on the sample size.
Curated OER
Descriptive Prompt
Students create a detailed self portrait, and then write about their appearance.
Curated OER
Genes Count
Students view a video that reviews Mendelian genetics. They discuss the Hardy-Weinberg Law and use Popsicle sticks to simulate genetic variations and ratios in offspring.
Curated OER
Personal Fitness Assessment
Students engaged in practice for a physical fitness exam. The practice is beneficial for overall student fitness. The instructor measures key factors of health that include height and weight.
Curated OER
Driving Precaustions
High schoolers explore the rules and regulations drivers must adhere to. As a class, they list safe driving procedures and identify the consequences of driving while impaired. Students write questions about safe driving practices. ...
Curated OER
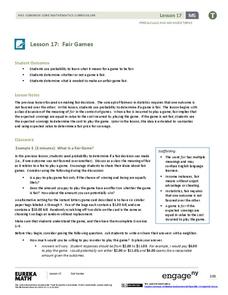
Fair Games
Fifth graders examine the statistics of playing games. Many games of chance and activities in maths text books involve rolling two dice and combining the scores, usually by addition. Students often find the probabilities of such events...
Curated OER
Finding Caterpillars
Students examine how animals protect themselves from predators and camouflage themselves. They participate in a simulation in which they locate red and green yarn "caterpillars," organize their data, and generate a bar graph using...
Curated OER
Orca United Nations
Learners study the differences between sets of data and explain how organisms are adapted to their environment. In this marine mammals lesson students analyze data based on set criteria.
Curated OER
Phrasal Verbs with Get
Students identify ten phrasal verbs with "get". In this phrasal verbs lesson plan, students read and analyze a conversation between two people. Students interpret the meaning of the phrases in the diaglogue. Games and additional...
Curated OER
Meaning of Alpha
learners define the alpha level. In this statistics lesson, students identify what makes the "null rejected" and discuss the data surrounding the null. They observe the meaning of alpha as it relates to the bell curve.
Curated OER
Hunting for galaxies in the Hubble Deep Field
Students examine Hubble Deep Field images. In this galaxy classification instructional activity, students research galaxy classification. Students view and classify Hubble Deep field images of galaxies.
Curated OER
School Climate, Where Are We Now?
Learners complete a school climate survey. They analyze the results and decide on an area of need in the school. They recommend a plan of action and complete it.
Curated OER
High Exposure
Young scholars interpret data they receive from the media, discuss possible misinterpretation of data from the media and correctly respond to the misconception quiz question.
Curated OER
Metropolitan Areas in the USA
Fifth graders explore why people live in certain regions of the United States. They investigate information on specific metropolitan areas such as temperature, population, natural resources, precipitation and landforms. In groups, 5th...
Curated OER
Blood Brothers
Middle schoolers study the blood characteristics of a number of distinct racial/ethnic groups. They build skills in observation, information gathering and processing. Students experiences strongly reflect the nature and intent of the...
Cuemath
Cuemath: Frequency Distribution Table
A comprehensive guide for learning all about frequency distribution tables with definitions, how to create a frequency distribution table, and the formulas and graphs related to frequency distributions. With solved examples and...
Missouri State University
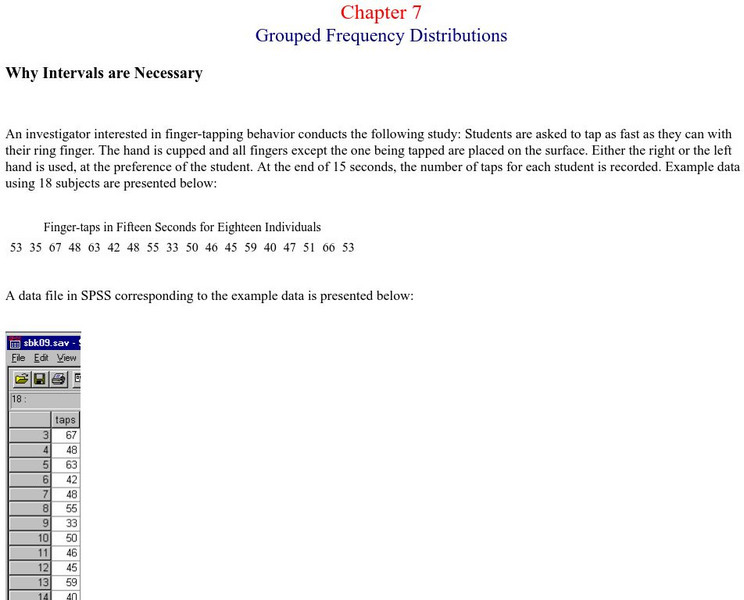
Missouri State Univ.: Introductory Statistics: Grouped Frequency Distributions
An example is provided for the explanation of grouped frequency distributions. Graphs show how to construct histograms and overlapping bell curves, and Excel documents are discussed as being useful here.
Missouri State University
Missouri State University: Introductory Statistics: Frequency Distributions
Provides a complete discussion of frequency distributions. Site is presented in notes with examples added as needed.
Wolfram Research
Wolfram Math World: Frequency Distribution
This site from MathWorld provides a general overview of frequency distribution, complete with a bar graph and explanatory text.
Math Is Fun
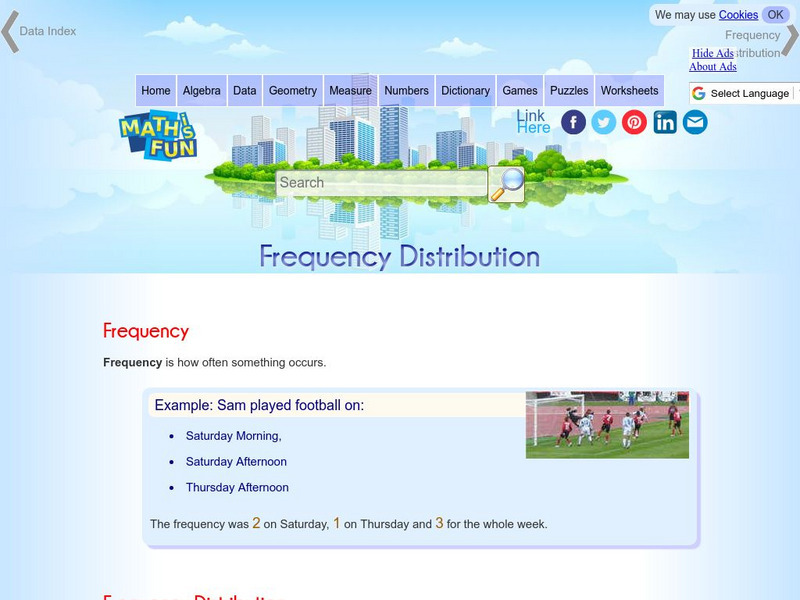
Math Is Fun: Frequency Distribution
Explains, with examples, what a frequency distribution table is. Includes a set of practice questions.
Palomar Community College District
Behavioral Science Stats: Grouped Frequency Distribution
A sample problem that utilizes frequency distributions to find the frequency, relative frequency, intervals and cumulative relative frequencies for the given problem. The example is worked through step-by-step with a great explanation...
McGraw Hill
Glencoe Mathematics: Online Study Tool: Quiz on Frequency Distributions
Learners demonstrate comprehension of advanced mathematical concepts. The online quiz tests the students on frequency distributions.


