McGraw Hill
Glencoe: Self Check Quizzes 1 Frequency Tables
Use Glencoe's randomly generated self-checking quiz to test your knowledge of frequency tables. Each question has a "Hint" link to help. Choose the correct answer for each problem. At the bottom of the page click the "Check It" button...
Varsity Tutors
Varsity Tutors: Hotmath: Algebra Review: Frequency Distributions
Find a quick, concise explanation of frequency distributions. An example is given and clearly explained.
Other
Clayton State: Organizing & Presenting a Frequency Dist.
The easiest method of organizing data is a frequency distribution, which converts raw data into a meaningful pattern for statistical analysis. Learn how in this tutorial with examples.
Mangahigh
Mangahigh: Data: Use Frequency Tables
This site provides students practice with the concept of frequency tables. Students can learn about the topic by completing an interactive tutorial. Students can then take a ten question timed test to practice the skill.
Khan Academy
Khan Academy: Two Way Frequency Tables
Given a Venn diagram or information about a relationship, create a two-way frequency table. Students receive immediate feedback and have the opportunity to try questions repeatedly, watch a video, or receive hints.
Khan Academy
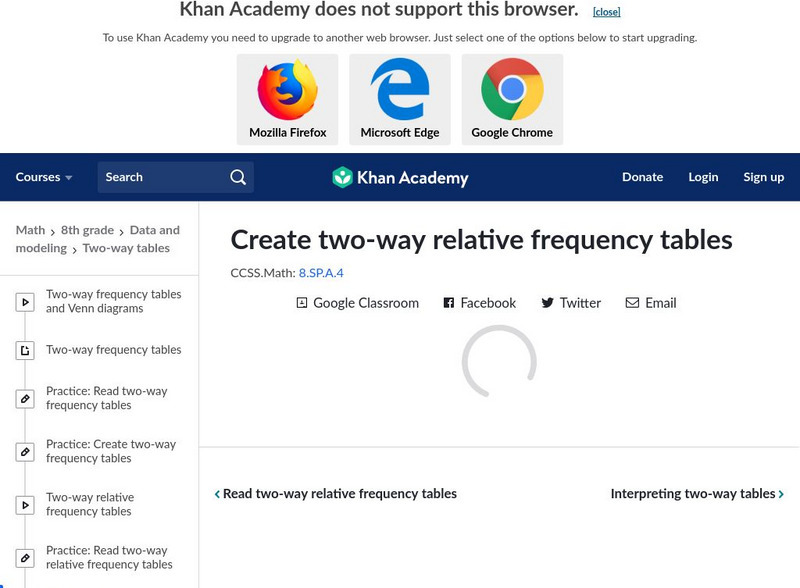
Khan Academy: Two Way Relative Frequency Tables
Practice creating two-way relative frequency tables from a two-way frequency table. Students receive immediate feedback and have the opportunity to try questions repeatedly, watch a video, or receive hints.
Khan Academy
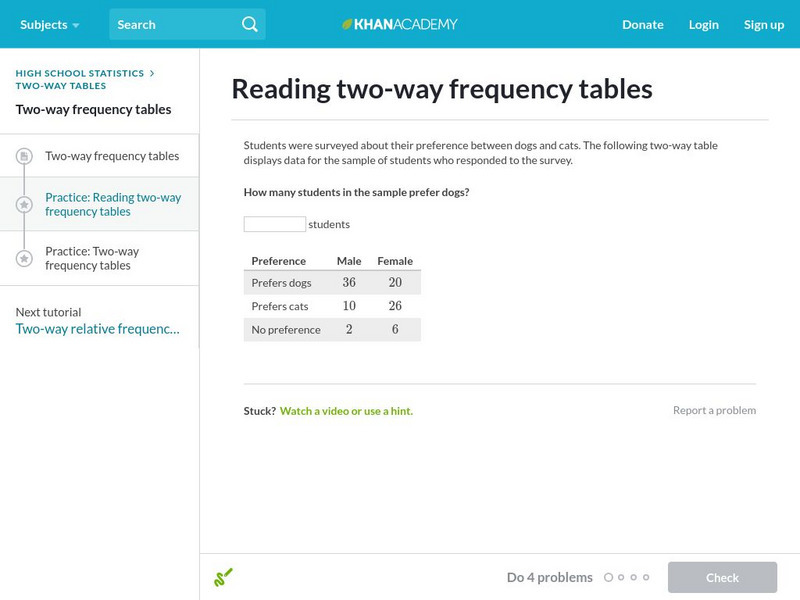
Khan Academy: Reading Two Way Frequency Tables
Practice interpreting two-way frequency tables. For example, what does the cell in the top left tell you? Students receive immediate feedback and have the opportunity to try questions repeatedly, watch a video, or receive hints.
CK-12 Foundation
Ck 12: Statistics: Frequency Polygons
[Free Registration/Login may be required to access all resource tools.] Construct frequency polygons.
Khan Academy
Khan Academy: Creating Frequency Tables
In this exercise, students practice creating frequency tables. Students receive immediate feedback and have the opportunity to get hints and try questions repeatedly.
Khan Academy
Khan Academy: Dot Plots and Frequency Tables Review
Dot plots and frequency tables are tools for displaying data in a more organized fashion. In this article, we review how to make dot plots and frequency tables.
CK-12 Foundation
Ck 12: Interactive Geometry: 11.4 Two Way Frequency Tables
With two pieces of data, learn how to organize the data into a two-way frequency table.
Quia
Ixl Learning: Frequency Tables
Brush up on your math skills relating to frequency tables then try some practice problems to test your understanding.
Khan Academy
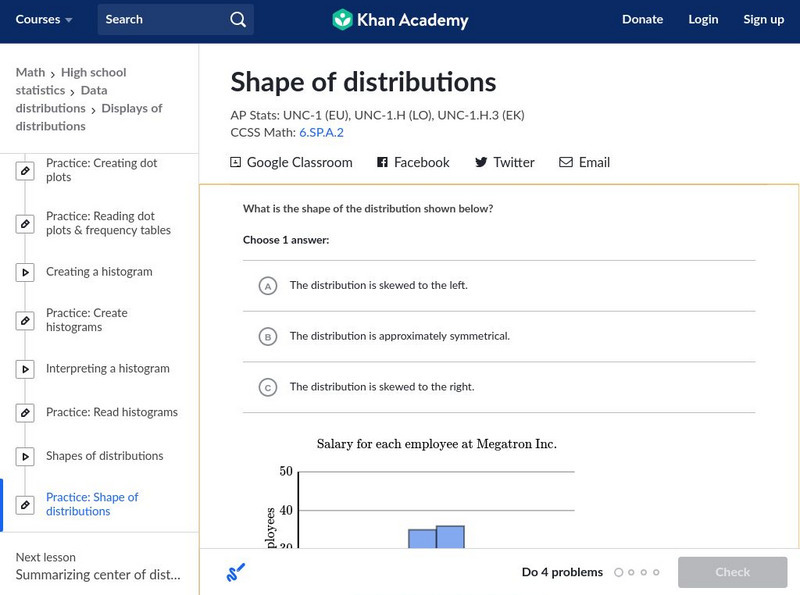
Khan Academy: Shape of Distributions
Practice explaining the shapes of data distributions. Some distributions are symmetrical, perfectly balanced on the left and right. Other distributions are unbalanced. We say they are "askewed" and have "tails." Students receive...
Khan Academy
Khan Academy: Comparing Distributions
Practice comparing distributions that are presented in dot plots, histograms, and box plots. Students receive immediate feedback and have the opportunity to try questions repeatedly, watch a video or receive hints.
Khan Academy
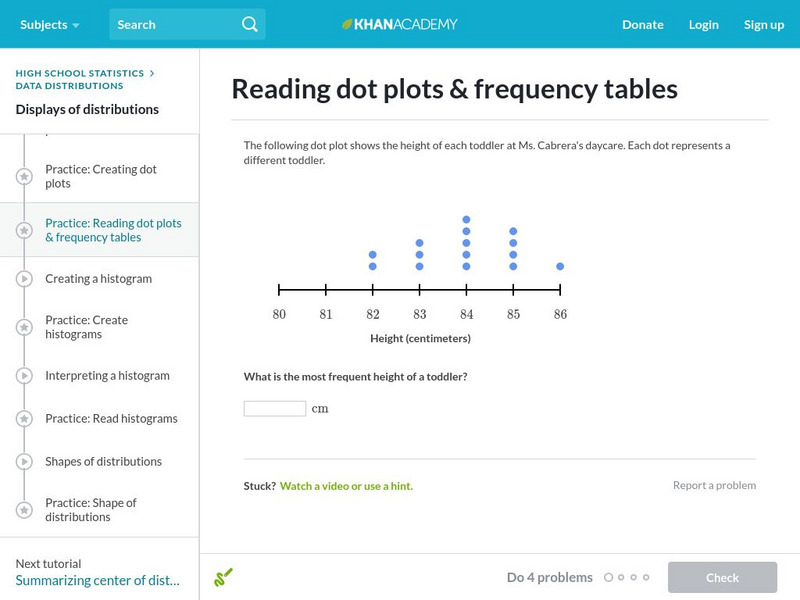
Khan Academy: Reading Dot Plots and Frequency Tables
In this exercise, students practice reading dot plots and frequency tables. Students receive immediate feedback and have the opportunity to get hints and try questions repeatedly.
Palomar Community College District
Palomar College: Relative Frequency Polygon
A step-by-step worked problem from the Palomar College demonstrating how to take a set of data and produce a relative frequency polygon. Hints are provided along the way, and the final graph is shown for the user to check.
Texas Instruments
Texas Instruments: Frequency Data
Student activity for developing vocabulary with respect to frequency of data represented in various forms.
Palomar Community College District
Palomar College: Frequency Polygon an Example
A step-by-step worked problem demonstrating how to take a set of data and produce a frequency polygon. Hints are provided along the way and the final graph is shown for the user to check.
Science Education Resource Center at Carleton College
Serc: Exploring Distributions and Graphs Using Cooperative Learning
Using cooperative learning methods, this lesson introduces distributions for univariate data, emphasizing how distributions help us visualize central tendencies and variability. Learners collect real data on head circumference and hand...
Khan Academy
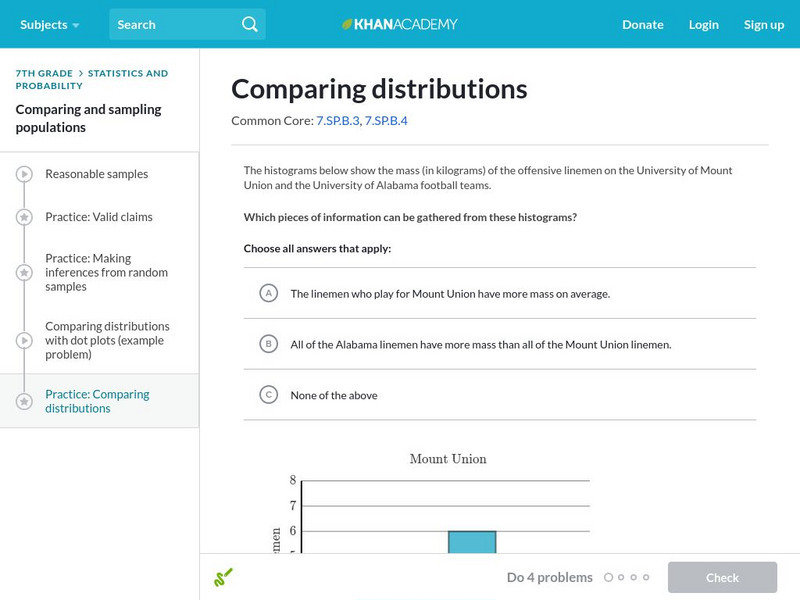
Khan Academy: Comparing Distributions
Try these practice problems comparing distributions.
Rice University
Hyper Stat Online Statistics Textbook: Cumulative Distribution
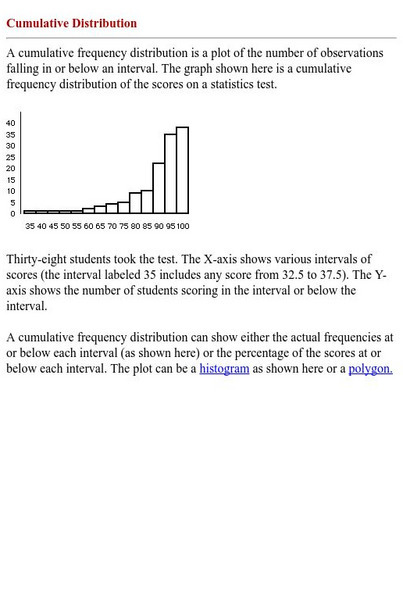
This resoruce explains how to read a cumulative frequency distribution graph.
Georgia Department of Education
Ga Virtual Learning: Disease Occurrence, Distribution and Patterns
In this comprehensive interactive tutorial you will learn how scientists measure the occurrence of disease and track the distribution of disease while trying to analyze patterns of illness.
Palomar Community College District
Palomar Community College: Behavioral Science Statistics: Class Intervals
A sample problem on creating intervals for a frequency distribution. The example is worked out and explained along the way.
CK-12 Foundation
Ck 12: Statistics: Ungrouped Data to Find the Mean
[Free Registration/Login may be required to access all resource tools.] Covers frequency distribution tables with ungrouped data.


