Stefan Warner and Steven R. Costenoble
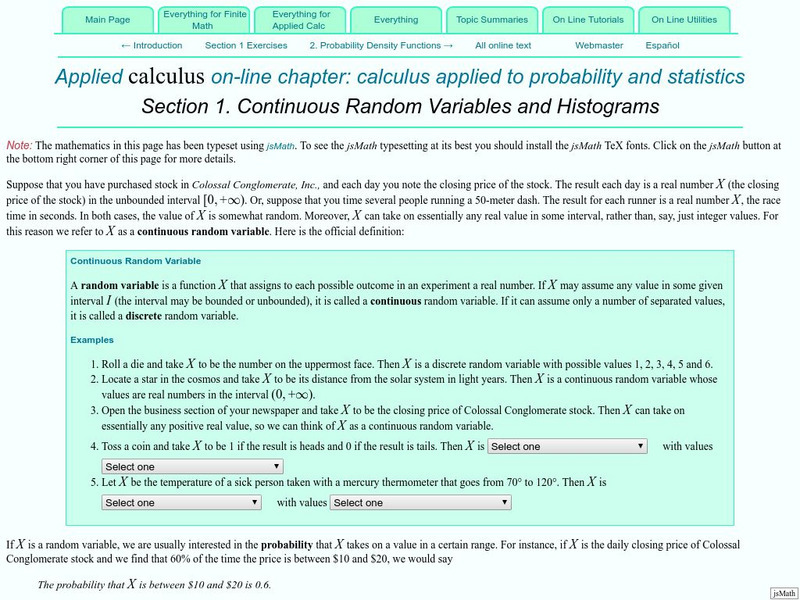
Finite Mathematics & Applied Calculus: Continuous Random Variables and Histograms
Students learn about random variables and histograms. Topics explored are continuous random variables, discrete random variables, probability, and frequency distributions. The tutorial investigtes the statistics concepts through class...
CK-12 Foundation
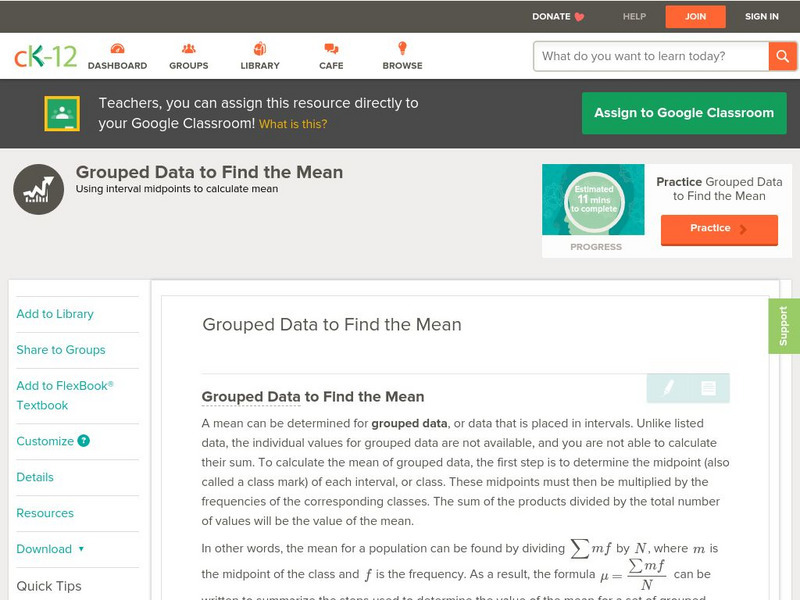
Ck 12: Statistics: Grouped Data to Find the Mean
[Free Registration/Login may be required to access all resource tools.] Covers frequency distribution tables with grouped data.
Other
Online Statistics Education: Graphing Distributions [Pdf]
This is the second chapter of a statistics e-text developed collaboratively by Rice University, University of Houston Clear Lake, and Tufts University. It looks at many different types of data displays and the advantages and...
Khan Academy
Khan Academy: Cumulative Relative Frequency Graph Problem
Cumulative relative frequency graph problem.
Mangahigh
Mangahigh: Data: Find the Class Interval Containing the Mode
Students watch an online tutorial on the concept of finding mode from a frequency table. After watching, students test their knowledge by attempting ten practice problems that increase or decrease in difficulty based on their answers.
Khan Academy
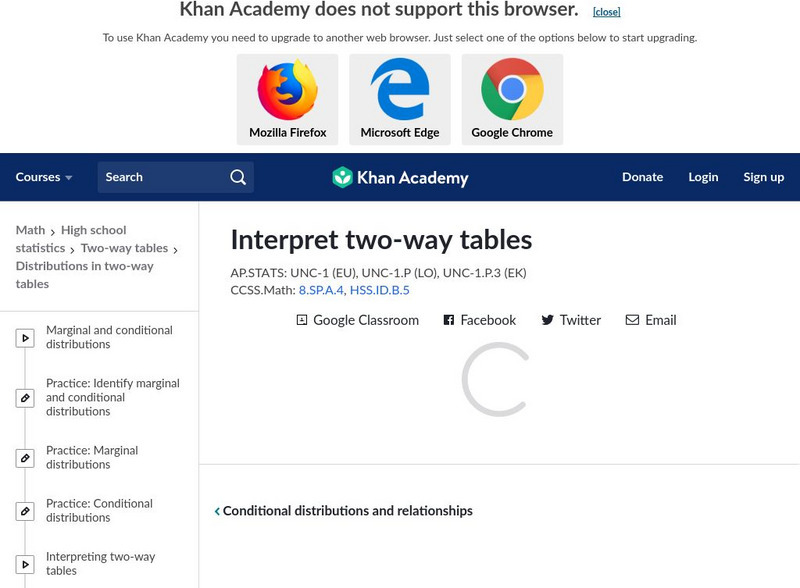
Khan Academy: Conditional Distributions and Relationships
A small private college was curious about what levels of students were getting straight A grades. College officials collected data on the straight A status from the most recent semester for all of their undergraduate and graduate students.
Mangahigh
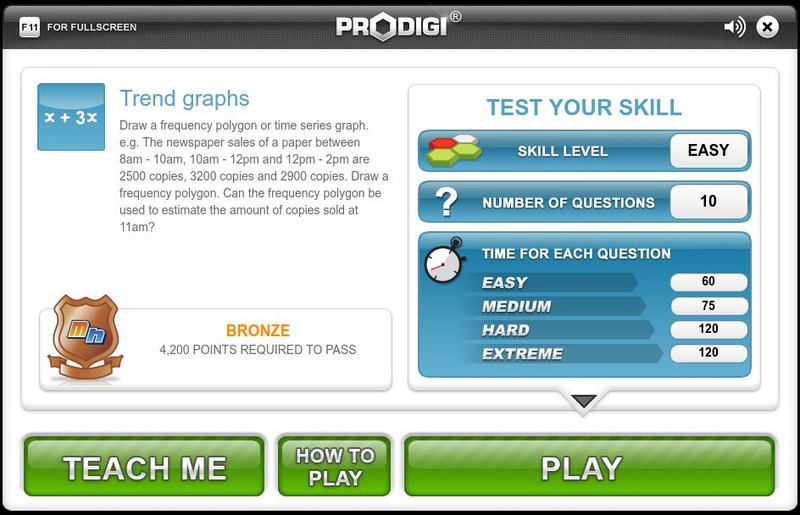
Mangahigh: Data: Trend Graphs
Students explore the concept of frequency trend graphs by working through an online tutorial and then attempting a ten question quiz that increases in difficulty as questions are answered correctly.
CK-12 Foundation
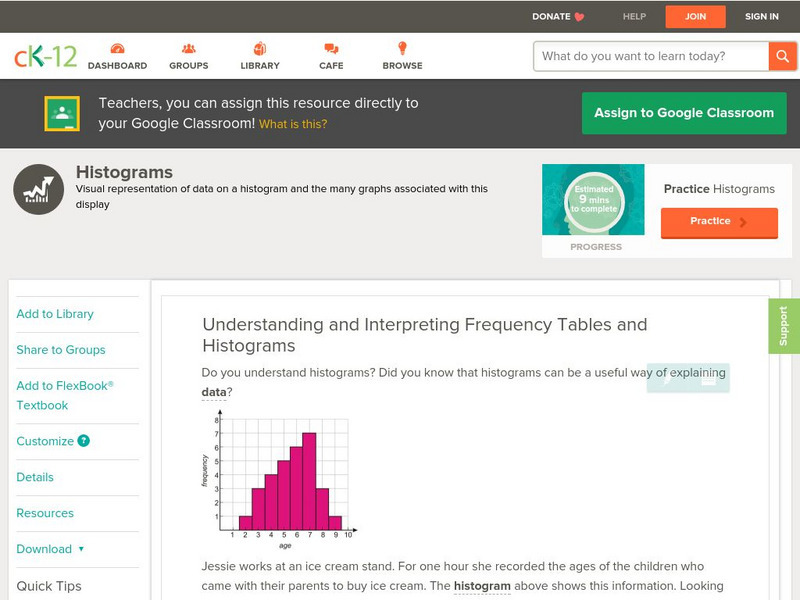
Ck 12: Statistics: Histograms Grades 11 12
[Free Registration/Login may be required to access all resource tools.] This Concept covers making frequency tables and using them to create a histogram.
Wolfram Research
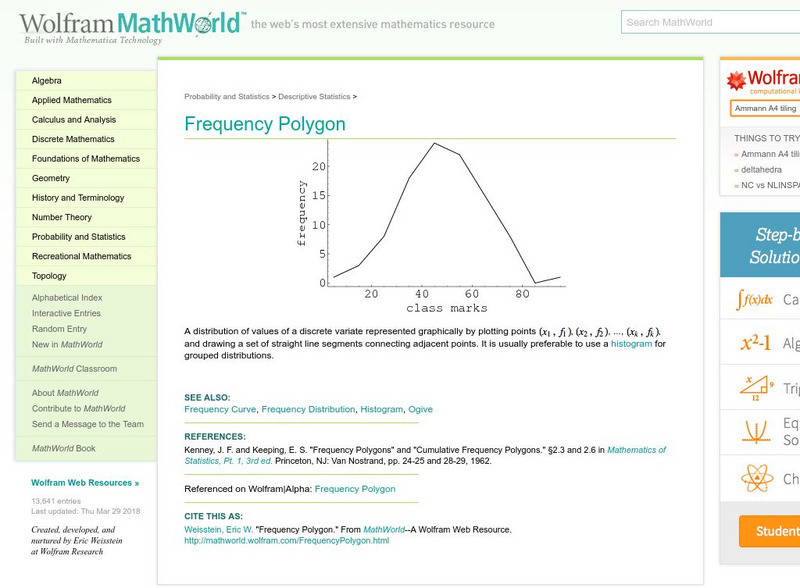
Wolfram Math World: Frequency Polygon
MathWorld provides a general overview of a frequency polygon, complete with a graphical example.
ClassFlow
Class Flow: Cumulative Frequency Data Handling
[Free Registration/Login Required] Students draw conclusions and engage in tables and charts involving cumulative frequency; a wonderful review of student's knowledge.
Texas Instruments
Texas Instruments: Probability as Relative Frequency
In this activity, students use simulation to justify the concept of the Law of Large Numbers. They understand that as the sample size increases, the relative frequency of which an event occurs approaches the probability of that event...
Texas Education Agency
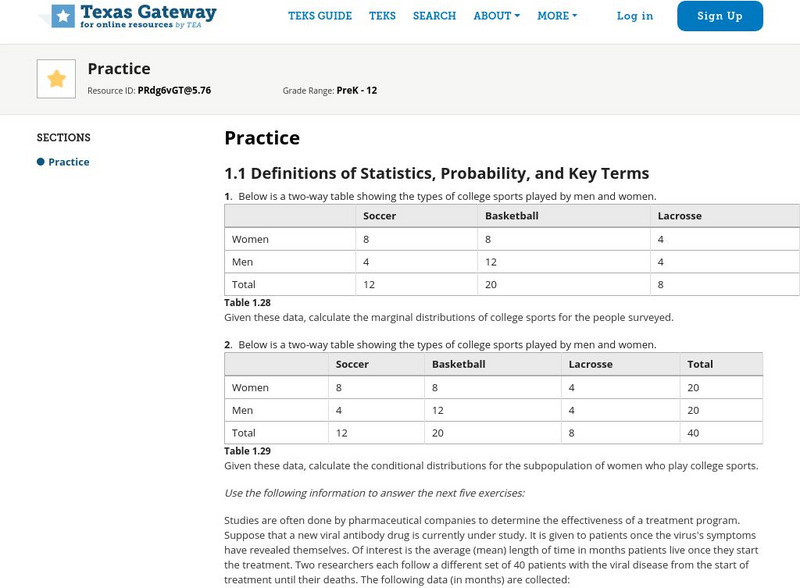
Texas Gateway: Tea Statistics: Sampling and Data: Practice
A set of exercises where students must analyze statistcal data and methodology and answer questions about distributions, sampling, results, accuracy, frequency, experimental design, and ethical practices.
CK-12 Foundation
Ck 12: Statistics: Histograms Grade 8
[Free Registration/Login may be required to access all resource tools.] Students will interpret frequency tables and connect data to histograms.
Richland Community College
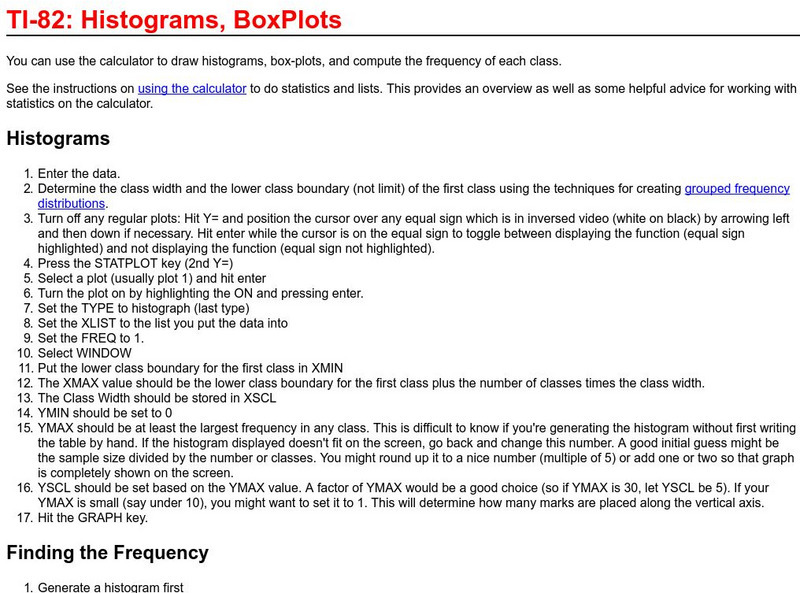
Richland College: Ti 82 Histograms / Box Plots
Richland College provides a step-by-step procedure on how to use a TI-82 to construct histograms and box plots and then use this to find frequency distribution.
PBS
Pbs Learning Media: Restocking Shoes
In this video from Cyberchase, Bianca uses data on past shoe sales to help her decide what quantities of each size she should order in the next shipment.
Other
Vlps: Mean and Standard Deviation
Explanation of frequency distributions, mean, standard deviations, and variance including a Java Applet.
CK-12 Foundation
Ck 12: Statistics: Histograms Grades 9 10
[Free Registration/Login may be required to access all resource tools.] Make a histogram given a frequency table.
CK-12 Foundation
Ck 12: Statistics: Histograms Grade 7
[Free Registration/Login may be required to access all resource tools.] Make a histogram given a frequency table.
University of Texas at Austin
Mathematics Teks Toolkit: The Sounds of Music
In this lesson, students collect data, graph it, then determine the period and frequency of the sound waves made by a guitar.
PBS
Pbs Learning Media: Global Landslide Catalog
Landslides cause between 1-2 billion dollars in damage per year in the U.S. alone. NASA tracks landslides globally in order to analyze trends in landslide frequency, distribution, and impacts to help scientists better predict landslides...
Geographypods
Geographypods: Hazards and Risk Management: Drought
This learning module looks at droughts. It examines their characteristics and distribution, how they are measured, their causes, how they can be predicted, and their frequency in Africa. Includes handouts, maps, activities, and videos.
Missouri State University
Missouri State U.: Introductory Statistics: Concepts, Models, and Applications
This is a comprehensive online text about statistics which covers all the basic concepts.
Cuemath
Cuemath: Mean, Median and Mode
A comprehensive guide for learning all about mean, median, and mode with definitions, the relation between them, solved examples, and practice questions.
Khan Academy
Khan Academy: Interpreting Two Way Tables
Do you understand how two-way tables really work? Here's your chance to practice. Students receive immediate feedback and have the opportunity to try questions repeatedly, watch a video, or receive hints.


![Online Statistics Education: Graphing Distributions [Pdf] eBook Online Statistics Education: Graphing Distributions [Pdf] eBook](https://d15y2dacu3jp90.cloudfront.net/images/attachment_defaults/resource/large/FPO-knovation.png)


