Khan Academy
Khan Academy: Creating Frequency Tables
In this exercise, students practice creating frequency tables. Students receive immediate feedback and have the opportunity to get hints and try questions repeatedly.
CK-12 Foundation
Ck 12: Interactive Geometry: 11.4 Two Way Frequency Tables
With two pieces of data, learn how to organize the data into a two-way frequency table.
Quia
Ixl Learning: Frequency Tables
Brush up on your math skills relating to frequency tables then try some practice problems to test your understanding.
Khan Academy
Khan Academy: Two Way Tables Review
Two-way tables organize data based on two categorical variables.
Khan Academy
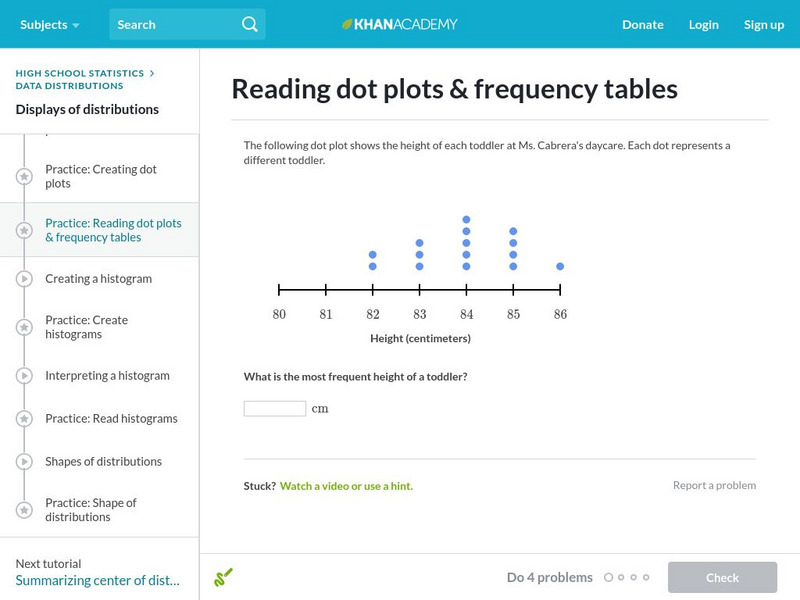
Khan Academy: Reading Dot Plots and Frequency Tables
In this exercise, students practice reading dot plots and frequency tables. Students receive immediate feedback and have the opportunity to get hints and try questions repeatedly.
Palomar Community College District
Palomar College: Frequency Polygon an Example
A step-by-step worked problem demonstrating how to take a set of data and produce a frequency polygon. Hints are provided along the way and the final graph is shown for the user to check.
Mangahigh
Mangahigh: Data: Find the Class Interval Containing the Mode
Students watch an online tutorial on the concept of finding mode from a frequency table. After watching, students test their knowledge by attempting ten practice problems that increase or decrease in difficulty based on their answers.
CK-12 Foundation
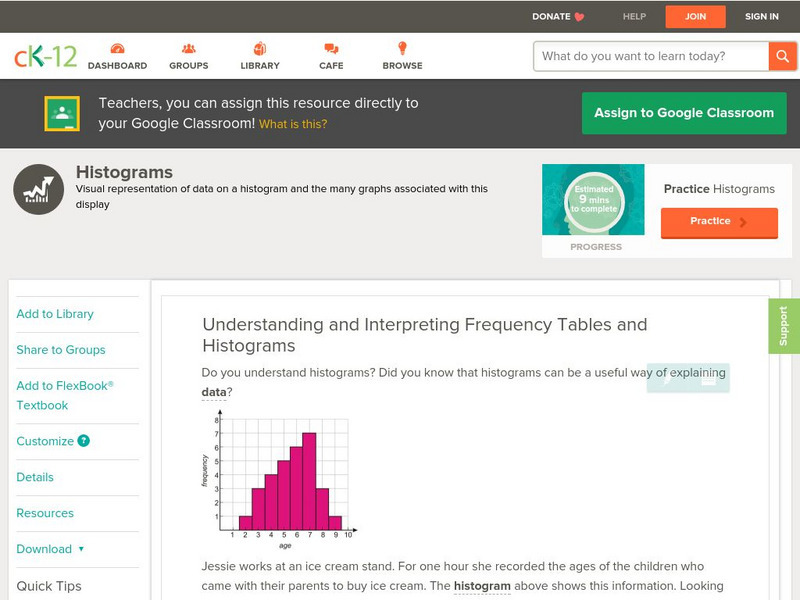
Ck 12: Statistics: Histograms Grades 11 12
[Free Registration/Login may be required to access all resource tools.] This Concept covers making frequency tables and using them to create a histogram.
Khan Academy
Khan Academy: Conditional Distributions and Relationships
A small private college was curious about what levels of students were getting straight A grades. College officials collected data on the straight A status from the most recent semester for all of their undergraduate and graduate students.
ClassFlow
Class Flow: Cumulative Frequency Data Handling
[Free Registration/Login Required] Students draw conclusions and engage in tables and charts involving cumulative frequency; a wonderful review of student's knowledge.
Varsity Tutors
Varsity Tutors: Hotmath: Practice Problems: Tables and Graphs
Six problems present various aspects of using and making tables and graphs to display statistics. They are given with each step to the solution cleverly revealed one at a time. You can work each step of the problem then click the "View...
Texas Education Agency
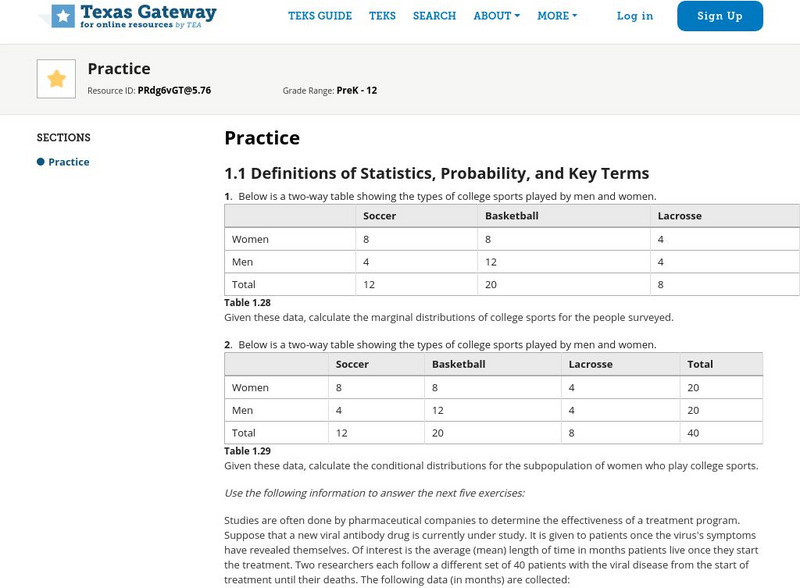
Texas Gateway: Tea Statistics: Sampling and Data: Practice
A set of exercises where students must analyze statistcal data and methodology and answer questions about distributions, sampling, results, accuracy, frequency, experimental design, and ethical practices.
CK-12 Foundation
Ck 12: Statistics: Histograms Grade 8
[Free Registration/Login may be required to access all resource tools.] Students will interpret frequency tables and connect data to histograms.
CK-12 Foundation
Ck 12: Statistics: Histograms Grade 7
[Free Registration/Login may be required to access all resource tools.] Make a histogram given a frequency table.
CK-12 Foundation
Ck 12: Statistics: Histograms Grades 9 10
[Free Registration/Login may be required to access all resource tools.] Make a histogram given a frequency table.
University of Texas at Austin
Mathematics Teks Toolkit: The Sounds of Music
In this lesson, students collect data, graph it, then determine the period and frequency of the sound waves made by a guitar.
Illustrative Mathematics
Illustrative Mathematics: S Cp How Do You Get to School?
All of the upper-division students (juniors and seniors) at a high school were classified according to grade level and response to the question "How do you usually get to school?" The resulting data are summarized in a two-way table and...
Missouri State University
Missouri State U.: Introductory Statistics: Concepts, Models, and Applications
This is a comprehensive online text about statistics which covers all the basic concepts.
Richland Community College
Richland Community College: Stats Graphs Defined
Richland Community College provides a glossary of many terms that are needed in order to understand statistics graphs and charts. Each of the types of charts is quickly explained in terms of what it is most effective in displaying.
Other
Stat Soft: Statistics Glossary
Dozens of statistical terms are defined and illustrated in this glossary.
Khan Academy
Khan Academy: Creating Dot Plots
Practice creating dot plots. Dot plots are very similar to frequency tables, but they make it easier to see the data. Students receive immediate feedback and have the opportunity to try questions repeatedly, watch a video or receive hints.


