Curated OER
Discussion Sheet 7: Exponential Growth
For this exponential growth worksheet, students determine the population of a country. They set up an integral which represents the mass of an abject and determined the total accumulation of snow in a region. This one-page worksheet...
Inside Mathematics
Population
Population density, it is not all that it is plotted to be. Pupils analyze a scatter plot of population versus area for some of the states in the US. The class members respond to eight questions about the graph, specific points and...
Inside Mathematics
Squares and Circles
It's all about lines when going around. Pupils graph the relationship between the length of a side of a square and its perimeter. Class members explain the origin in context of the side length and perimeter. They compare the graph to the...
Perkins School for the Blind
Student Store
Vocational training activities are extremely important for learners with intellectual or physical disabilities. Here is a great idea that will help your class become skilled at money handling, basic economic concepts, interpersonal...
EngageNY
One-Step Equations—Multiplication and Division
Discover one more step to being able to solve any one-step equation. Scholars continue their work with one-step equations in the 28th installment of a 36-part module. Tape diagrams and algebraic processes introduce how to solve one-step...
Noyce Foundation
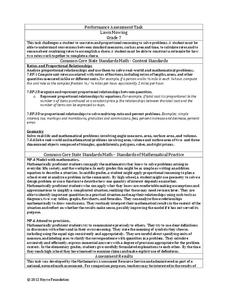
Lawn Mowing
This is how long we mow the lawn together. The assessment requires the class to work with combining ratios and proportional reasoning. Pupils determine the unit rate of mowers and calculate the time required to mow a lawn if they work...
Inside Mathematics
Swimming Pool
Swimming is more fun with quantities. The short assessment task encompasses finding the volume of a trapezoidal prism using an understanding of quantities. Individuals make a connection to the rate of which the pool is filled with a...
Inside Mathematics
Rhombuses
Just what does it take to show two rhombuses are similar? The assessment task asks pupils to develop an argument to show that given quadrilaterals are rhombuses. Class members also use their knowledge of similar triangles to show two...
Inside Mathematics
Marble Game
Pupils determine the theoretical probability of winning a game of marbles. Individuals compare the theoretical probability to experimental probability for the same game. They continue on to compare two different probability games.
Illustrative Mathematics
Crude Oil and Gas Mileage
Here is an activity that presents a real-world problem about the relationship between crude oil production and the gas mileage of modern automobiles. After learners write functions to describe the relationships, they are asked to find...
Curated OER
Snail Invasion
Exponential growth is modeled by learners as they analyze and interpret the data presented in this real-life scenario centered on the destructive invasion of the Giant African Land Snail. Learners get a touch of history and practice...
Virginia Department of Education
Linear Curve of Best Fit
Is foot length to forearm length a linear association? The class collects data of fellow scholars' foot length and the length of their forearms. They plot the data and find a line of best fit. Using that line, they make predictions of...
Curated OER
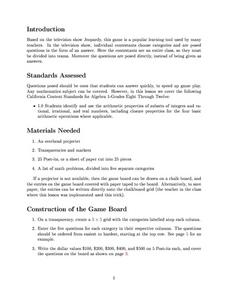
Mathematical Jeopardy
Middle schoolers use the popular game of Jeopardy to explore different mathematical concepts. They are highly engaged with the use of technology for this lesson. They function using higher-order thinking skills in order to create their...
Macmillan Education
Sine and Cosine Graphs
Learners compare and contrast sine and cosine graphs in order to describe their characteristics in a collaborative activity. As they explain their reasoning, learners strengthen their writing and vocabulary skills associated with sine...
West Contra Costa Unified School District
Polynomial Division
Multiply the ways your scholars can find the quotient with polynomial division. A lesson plan introduces polynomial division via long division, synthetic division, generic area model, and using the definition of division. Learners then...
Flipped Math
Calculus AB/BC - Using the Second Derivative Test to Determine Extrema
Take a second look at extrema of functions. Pupils learn how to use the second derivative to determine whether a critical point is a maximum or a minimum. Learners use concavity to identify critical points as either a max or a min and...
Curated OER
Data, Data, Everywhere... and What Am I To Think?
Students demonstrate good random sampling techniques for data collection, select and develop graphic presentations of data and analyze the data to solve a problem presented.
Curated OER
Conversation Lesson: Men and Women - Equal at Last?
Students engage in a debate about equality between men and women as a way to work on their conversational skills. The format of the debate is imbedded in this plan.
Curated OER
Seam Allowances and Reading Measuring Tapes
Homemade clothes are so fun to wear, and they are also fun to make! Have young tailors sew seam allowances using a measuring tape to the nearest 1/8th inch. The lesson includes three related docs and includes those all-important...
Curated OER
Iterating Linear Functions
Students use a spreadsheet to investigate data. In this algebra lesson, students collect and graph data on a coordinate plane. They explain properties of a linear equation both algebraically and orally.
Curated OER
Making Blood!
students research blood's components, and use their math skills to recreate a model of whole blood using commonly found food items.
Curated OER
Supplemental Exercises for Section 2.6
Practing their functions skills, students solve seven short answer (computation) problems. They tell the points that each function is continuous. The answers to three of the problems are included on the worksheet.
Curated OER
How Much Data is That?
Students differentiate between exponential and logarithmic functions. In this algebra lesson, students use logarithmic properties to solve equations. They identify growth and decay of graphs.
Curated OER
Earthquakes
Eighth graders demonstrate the mathematical components of a scientific problem as well as illustrate how real world problems can be solved using math. They demonstrate math skills such as rate calculation, graphing, and linear equations.


