Illustrative Mathematics
How is the Weather?
This activity asks learners to interpret data displayed on a graph within the context of the problem. Students are given three graphs that show solar radiation, or intensity of the sun, as a function of time. They are also given three...
Illustrative Mathematics
Warming and Cooling
Is it too hot to go hiking? This task asks learners to refer to a graph that shows temperature as a function of time and answer five questions about the scenario depicted by the graph. The exercise could be used for instruction to help...
Curated OER
Ellipses and Kepler's First Law
The class examines graphs in the form r = F(¿¿) in polar coordinates (r, ¿¿), in particular with the circle, ellipse and other conic sections. They determine the nature of an ellipse by studying the role of the semimajor axis and...
Curated OER
Design Patterns
Students extend and create patterns. Through a variety of activities, they discover patterns as they exist in math and their everyday lives. Students create a necklace that represents a pattern.
Curated OER
"How Many Names for 100?"
Fifth graders work on the different possibilities of reaching the number 100. The class is divided into homogeneous groups for cooperative learning. The activity uses discussion questions to help with problem solving.
Curated OER
Is there Treasure in Trash?
More people, more garbage! Young environmentalists graph population growth against the amount of garbage generated per year and find a linear model that best fits the data. This is an older resource that could benefit from more recent...
Curated OER
Parallel Lines and Properties of Slope
Students define functions to be graphed using the Y=key. They demonstrate how to set up a standard viewing screen using Zoom 6. They discuss and explore mathematical questions on a worksheet.
Curated OER
Count on Me
Fourth graders use inductive reasoning to find algebraic patterns in geometric figures. They use technology (i.e., calculators, computers) and manipulatives to discover number patterns involving geometric concepts. They solve concrete...
Illustrative Mathematics
Springboard Dive
Dive into this problem that illustrates a real-world application of the quadratic formula. Learners are given an equation that represents the height of a diver above the water t seconds after leaving the springboard. The task is to...
Curated OER
Box Plots
Young statisticians are introduced to box plots and quartiles. They use an activity and discussion with supplemental exercises to help them explore how data can be graphically represented.
Curated OER
Rational, Irrational and Square Roots
Students identify rational and irrational numbers and their use in mathematical functions. Through demonstration, students discover the difference between rational and irrational numbers and their use. Using estimation skills students...
Curated OER
Weather In The World
Students investigate the weather in different places in the world. In this algebra lesson, students use technology to gain an understanding of how to study integers. They add and subtract integers on a number line.
Curated OER
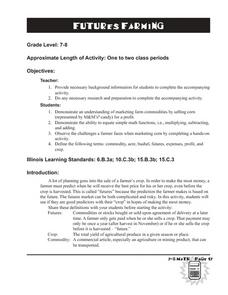
Farmers Dilemma
Students investigate the "futures" market and how it affects farmers by completing a prediction activity utilizing bags of M&Ms. While completing this activity, students practice basic mathematics skills and reinforce economic terms.
Shodor Education Foundation
Graphing and the Coordinate Plane
Ready to introduce your class to the coordinate plane? This website includes a detailed lesson plan that includes two interactive games to help learners practice graphing ordered pairs. The scripted discussion is a little cheesy and a...
Curated OER
Adding and Subtracting Algebraic Expressions (Combining Like Terms)
Everyone loves math when it includes food! This lesson tries to take the notion of combining like terms in algebra and comparing it to sorting apples and oranges. It takes a step-by-step approach to helping students understand this...
Curated OER
Multiplying Exponents vs. Powers of Powers
Use the power of a power property to solve exponential functions. The lesson refers to differentiating between multiplying or adding exponents to find the value, and how to find the product of a power of a power.
Curated OER
Investigation - Looking For Triangles
Seventh graders investigate a series of triangles, looking for patterns and generalizing what they have found. They analyze the pattern data and organize it into a table and graph. Students identify the relationship and discover the rule...
Curated OER
Geometry: Parallel and Perpendicular Lines
This basic handout would be good for skills practice or a review of parallel and perpendicular lines. Review the definitions, then practice writing equations of lines that pass through a specific point and are either parallel or...
Illustrative Mathematics
Firefighter Allocation
Creating equations with one variable to solve real-world-type problems is a key skill any algebra learner needs to master. Here the focus is on realizing that one can write the equation in different ways depending upon how one...
Curated OER
Limits
In this limit instructional activity, students evaluate functions and determine the limits of the function. This one-page instructional activity contains 10 problems.
Curated OER
Radical Transformations
Students transform the square root function graphically. In this transforming the square root function graphically lesson, students use their Ti-Nspire to change the a, b, and c values of th square root graph. Students transform the...
Curated OER
My Test Book: Division
In this math skills worksheet, students solve 10 multiple choice math problems that regarding division of 2,3, and 4-digit numbers. Students may view the correct answers.
Curated OER
Mathematics-Algebra II
Tenth graders investigate relations and functions. For this algebra lesson, 10th graders perform or research real life situation involving functions. This assignment can be used as a year end project.
Curated OER
Oodles of Poodles
Students solve equations by graphing. In this algebra lesson, students differentiate between functions and relations. They use the TI to graph their equation and analyze the graph.


