Inside Mathematics
Expressions
Strive to think outside of the quadrilateral parallelogram. Worksheet includes two problems applying prior knowledge of area and perimeter to parallelograms and trapezoids. The focus is on finding and utilizing the proper formula and...
Noyce Foundation
Parallelogram
Parallelograms are pairs of triangles all the way around. Pupils measure to determine the area and perimeter of a parallelogram. They then find the area of the tirangles formed by drawing a diagonal of the parallelogram and compare their...
Noyce Foundation
Sewing
Sew up your unit on operations with decimals using this assessment task. Young mathematicians use given rules to determine the amount of fabric they need to sew a pair of pants. They must also fill in a partially complete bill for...
Inside Mathematics
Two Solutions
Many problems in life have more than one possible solution, and the same is true for advanced mathematics. Scholars solve seven problems that all have at least two solutions. Then three higher-level thinking questions challenge them to...
Virginia Department of Education
Solving and Graphing Inequalities
You can't go wrong with a lesson plan that involves candy! Learners solve and graph one-variable inequalities and use candy to graph the solution. Individuals associate open circle graphs with life savers and closed circle graphs with...
Virginia Department of Education
Normal Distributions
Pupils work to find probabilities by using areas under the normal curve. Groups work to calculate z-scores and solve real-world problems using the empirical rule or tables.
Virginia Department of Education
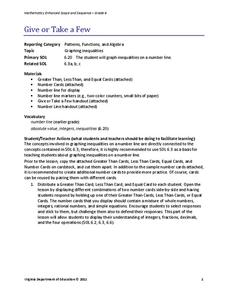
Give or Take a Few
Young mathematicians extend their knowledge of rational numbers on a number line to graph inequalities by first using number cards to compare rational numbers. They finish by using similar reasoning to graph inequalities on a number line.
Noyce Foundation
Time to Get Clean
It's assessment time! Determine your young mathematicians' understanding of elapsed time with this brief, five-question quiz.
Noyce Foundation
Ducklings
The class gets their mean and median all in a row with an assessment task that uses a population of ducklings to work with data displays and measures of central tendency. Pupils create a frequency chart and calculate the mean and median....
Noyce Foundation
Pizza Crusts
Enough stuffed crust to go around. Pupils calculate the area and perimeter of a variety of pizza shapes, including rectangular and circular. Individuals design rectangular pizzas with a given area to maximize the amount of crust and do...
Inside Mathematics
Archery
Put the better archer in a box. The performance task has pupils compare the performance of two archers using box-and-whisker plots. The resource includes sample responses that are useful in comparing individuals' work to others.
Inside Mathematics
Hopewell Geometry
The Hopewell people of the central Ohio Valley used right triangles in the construction of earthworks. Pupils use the Pythagorean Theorem to determine missing dimensions of right triangles used by the Hopewell people. The assessment task...
Inside Mathematics
Rugs
The class braids irrational numbers, Pythagoras, and perimeter together. The mini-assessment requires scholars to use irrational numbers and the Pythagorean Theorem to find perimeters of rugs. The rugs are rectangular, triangular,...
Inside Mathematics
Scatter Diagram
It is positive that how one performs on the first test relates to their performance on the second test. The three-question assessment has class members read and analyze a scatter plot of test scores. They must determine whether...
Virginia Department of Education
May I Have Fries with That?
Not all pie graphs are about pies. The class conducts a survey on favorite fast food categories in a lesson on data representation. Pupils use the results to create a circle graph.
Curated OER
Maximum/ Minimum Problems
In this optimization worksheet, students solve 20 short answer word problems. Students read, sketch, define variables, write equations, differentiate their equations, and find the maximum or minimum of each word problem.
Virginia Department of Education
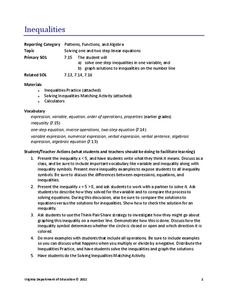
Inequalities
Not all resources are created equal — and your class benefits! Scholars learn how to solve one-step inequalities using inverse operations. They complete an activity matching inequalities to their solutions.
Virginia Department of Education
Balanced
Bring balance to your lesson plans with an activity that asks individuals to solve one-step linear equations with inverse operations. Balance scales help learners understand the concept of isolating the variable.
Baylor College
Do Plants Need Light?
Turn your classroom into a greenhouse with a lesson plan on plant growth. First, investigate the different parts of seeds, identifying the seed coat, cotyledon, and embryo. Then plant the seeds and watch them grow! Measure the new plants...
Curated OER
Mathematics-Algebra II
Tenth graders investigate relations and functions. For this algebra lesson, 10th graders perform or research real life situation involving functions. This assignment can be used as a year end project.
Curated OER
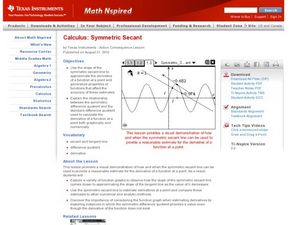
Symmetric Secant
Mathematicians use a symmetric secant line to prove the derivative at a point. In this trigonometry lesson, students create secant lines on the navigator to analyze the derivative. They move the lines around and make observations.
Curated OER
Dog Days or Dog Years?
In need of some algebraic fun with real world implications?Learners use ordered pairs, a table of values and a scatter plot to evaluate the validity of several real world data sets. The class focuses on dog ages in human years, domain,...
Curated OER
Data, Data, Everywhere... and What Am I To Think?
Students demonstrate good random sampling techniques for data collection, select and develop graphic presentations of data and analyze the data to solve a problem presented.
Curated OER
Celebrating the Fourth of July!
Students model projectile motion algebraically and graphically; and make predictions based on the quadratic algebraic model.


