Curated OER
Investigation - Looking For Triangles
Seventh graders investigate a series of triangles, looking for patterns and generalizing what they have found. They analyze the pattern data and organize it into a table and graph. Students identify the relationship and discover the rule...
Curated OER
Slopes and Linear Equations
Young scholars find the slopes of linear functions. In this graphing instructional activity, students analyze linear equations and calculate the slope of the line. They graph a line given the slope and y-intercept.
Portland
State
University
Historical Reflections on the Fundamental Theorem Of (Integral) Calculus
Highlight the process of mathematical discovery for your classes. This lesson examines the development of the Fundamental Theorem of Calculus over time. Understanding the history of the theorem helps create a better understanding of the...
Kenan Fellows
Lego Thinking and Building
Run a simulated airplane manufacturing plant with your pupils as the builders! Learners build Lego airplane models and collect data on the rate of production, comparing the number produced to the number defective. Using linear...
5280 Math
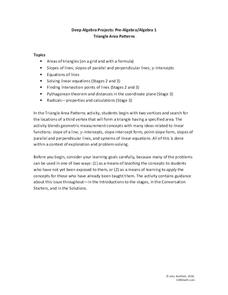
Triangle Area Patterns
Combine algebraic and geometric strategies to find solutions. The task asks learners to find the coordinates of a third vertex of a triangle to create a triangle with a specific area. The project is a set of seven problems that helps...
California Education Partners
Linflower Seeds
How does your garden grow? Use proportions to help Tim answer that question. By using their understanding of proportional relationships, pupils determine the number of seeds that will sprout. They create their own linear relationships...
Curated OER
Math- A Level Differentiated Lesson
Pupils investigate the gradient function of a polynomial and they conduct a class discussion about its meaning. Then students use graphing software in order to examine tangents that can be seen visually to aid those who need visual input...
Curated OER
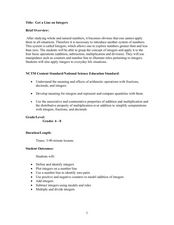
Get a Line on Integers
Students explore number sense by completing math function problems in class. In this integers lesson, students define integers and practice plotting them on a number line. Students utilize math functions such as addition and...
Curated OER
Don't Let Parabolas Throw You
Learners identify relation, function, patterns and range. In this algebra instructional activity, students factor and graph quadratic equations. They use transformation to move the parabola around and make predictions.
Curated OER
Mr. Payne Word Search Puzzle
In this language arts worksheet, students study 10 words in a word bank, then locate them in a word search puzzle. The words appear to be related to algebra; the meaning of the title is not known. There is one misspelled word in the word...
Curated OER
Walking on Air
Pupils collect and analyze data with a graph. In this statistics instructional activity, students use central tendencies to find the meaning of their data. They display the data on a Ti calculator.
Curated OER
Using Computers for Statistical Analysis of Weather
Students use temperature, cloud cover and other weather data from the S'COOL website to statistically analyze weather around the country. They use computers to calculate and graph standard deviations, means and modes of the weather...
Curated OER
Building Understanding of Rate of Change/Slopes Using Alice
Young scholars explore slope as a rate of change. In this eighth grade mathematics lesson, students investigate real-world problems to determine rate of change and transform it into a linear representation, thus determining slope. Young...
Curated OER
Virtual Field Trip
This hands-on resource has future trip planners analyze graphs of mileage, gasoline costs, and travel time on different routes. While this was originally designed for a problem-solving exercise using a Michigan map, it could be used as a...
Curated OER
Batting Practice: Using Math to Calculate Baseball Statistics
Students calculate and record batting average, hits, and at bats. In this Batting Practice: Using Math to Calculate Baseball Statistics lesson, students utilize mathematical formulas to determine the career statistics of baseball player...
Curated OER
Speaking Skills - Asking Questions
Students improve speaking confidence when using difficult question forms. This lesson focuses on helping students explain how to engage in this kind of social conversation. A worksheet imbedded in this plan provides practice.
Curated OER
You mean college costs that much?
Seventh graders collect, organize, and analyze data as they research colleges on the Internet. They graph their collected data on a line graph and use a spreadsheet on Microsoft Excel in order to organize the data.
Curated OER
Teaching and Learning Through Objects
Students identify and interpret the function, usefulness or utitlity, form, beauty or aesthetics, and meaning, context or story, of objects and how they learn new skills and make things that they learn traditionally, by observation and...
Curated OER
Ordered Pairs on a Coordinate Plane
Seventh graders identify the quadrants and axis of a coordinate plane. In this algebra instructional activity, 7th graders discover the correct way to graph using the coordinate plane. They discuss the relationship between x and y...
Curated OER
2.0 "Water Is Life" Global Water Awareness Mini-Unit (Grades3-5)
Young scholars study the amount of potable water on the Earth. For this water lesson, students examine the amount of potable water as compared to all the water on the Earth. They discuss why many parts of the world do not have access to...
Curated OER
Building Castles
Students research castle building. In this research and design lesson, students research castles, visit a Castle Builder website, and use graph paper to draw a blue print of a castle. Students continue to work on their castle building...
Curated OER
Slopey Math
Students identify the slope of a line and use it to solve real life problems. In this algebra activity, students write linear equations in slope intercept form and make a correlation to its relation to the real world. They use the slope...
Curated OER
Means of Growth
Students collect and graph data. For this statistics lesson, students analyze their plotted data using a scatter plot. They identify lines as having positive, negative or no correlation.
Illustrative Mathematics
Bike Race
A graph not only tells us who won the bike race, but also what happened during the race. Use this resource to help learners understand graphs. The commentary suggests waiting until the end of the year to introduce this topic, but why...


