Curated OER
Instantaneous Rate of Change of a Function
Pupils draw the graph of a door opening and closing over time. They graph a given function on their calculators, create a table of values and interpret the results by telling if the door is opening or closing and evaluate the average...
EngageNY
The Height and Co-Height Functions of a Ferris Wheel
Show learners the power of mathematics as they model real-life designs. Pupils graph a periodic function by comparing the degree of rotation to the height of a ferris wheel.
EngageNY
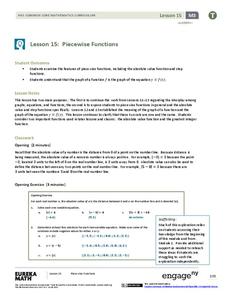
Piecewise Functions
Show your class members that if they can graph a linear function, they can graph an absolute value function. Groups create an absolute value graph using a table, then entertain the idea of an absolute value function defined as two...
EngageNY
Graphs of Exponential Functions and Logarithmic Functions
Graphing by hand does have its advantages. The 19th installment of a 35-part module prompts pupils to use skills from previous lessons to graph exponential and logarithmic functions. They reflect each function type over a diagonal line...
EngageNY
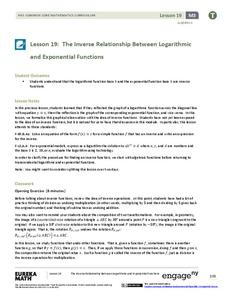
The Inverse Relationship Between Logarithmic and Exponential Functions
Introducing inverse functions! The 20th installment of a 35-part lesson encourages scholars to learn the definition of inverse functions and how to find them. The lesson considers all types of functions, not just exponential and...
EngageNY
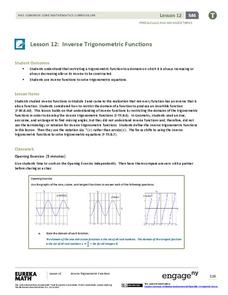
Inverse Trigonometric Functions
Build on the understanding of finding angles using trigonometric ratios. Pupils develop the definitions of inverse trigonometric functions by restricting their domains in the 13th lesson of a 16-part series. They use inverse functional...
EngageNY
Graphing the Tangent Function
Help learners discover the unique characteristics of the tangent function. Working in teams, pupils create tables of values for different intervals of the tangent function. Through teamwork, they discover the periodicity, frequency, and...
EngageNY
The “WhatPower” Function
The Function That Shall Not Be Named? The eighth installment of a 35-part module uses a WhatPower function to introduce scholars to the concept of a logarithmic function without actually naming the function. Once pupils are...
EngageNY
Revisiting the Graphs of the Trigonometric Functions
Use the graphs of the trigonometric functions to set the stage to inverse functions. The lesson reviews the graphs of the basic trigonometric functions and their transformations. Pupils use their knowledge of graphing functions to model...
EngageNY
Piecewise and Step Functions in Context
Looking for an application for step functions? This activity uses real data to examine piecewise step functions. Groups create a list of data from varying scenarios and create a model to use to make recommendations to increase...
EngageNY
Translating Graphs of Functions
If you know one, you know them all! Parent functions all handle translations the same. This lesson examines the quadratic, absolute value, and square root functions. Pupils discover the similarities in the behavior of the graphs when...
EngageNY
Stretching and Shrinking Graphs of Functions
Why is that graph wider? Pupils learn about stretching and shrinking graphs of square root, absolute value, cubic, and quadratic functions. They study both vertical and horizontal stretches and shrinks in addition to reflections.
EngageNY
Comparing Quadratic, Square Root, and Cube Root Functions Represented in Different Ways
Need a real scenario to compare functions? This instructional activity has it all! Through application, individuals model using different types of functions. They analyze each in terms of the context using the key features of the...
EngageNY
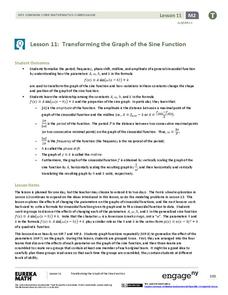
Transforming the Graph of the Sine Function
Build a solid understanding of trigonometric transformations through exploration. Learners work in teams to analyze the effects of different algebraic components on the graph of a sine function.
EngageNY
Modeling with Inverse Trigonometric Functions 2
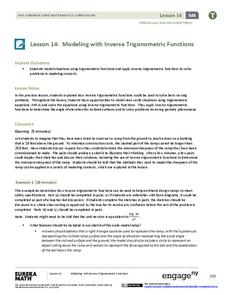
Use inverse trigonometric functions to work with ramps, rabbits, and Talladega. The class models real-world situations with trigonometric functions and solves them using inverses in the 15th installment of a 16-part series. Pupils solve...
EngageNY
Structure in Graphs of Polynomial Functions
Don't allow those polynomial functions to misbehave! Understand the end behavior of a polynomial function based on the degree and leading coefficient. Learners examine the patterns of even and odd degree polynomials and apply them to...
Curated OER
Algebra I: Linear Functions
Using rates from a rental car company, young mathematicians graph data, explore linear relationships, and discuss the role of slope and the y-intercept. This lesson allows for the discussion of independent and dependent variables, as...
EngageNY
Graphs of Piecewise Linear Functions
Everybody loves video day! Grab your class's attention with this well-designed and engaging resource about graphing. The video introduces a scenario that will be graphed with a piecewise function, then makes a connection to domain...
Project Maths
Trigonometric Functions
From a circle to a cycle! The final lesson of a five-part series challenges learners to use points from the unit circle to plot a repeating pattern. The repeating patterns become the graphs of the trigonometric functions. Scholars...
West Contra Costa Unified School District
Evaluating Functions
Functions as inputs for other functions? After reviewing function notation and how to input values to evaluate functions, class members input functions into functions, essentially determining the composition of functions.
Alabama Learning Exchange
Building Functions: Composition of Functions
Hammer away at building different types of functions. An engaging activity builds on learners' knowledge of domain and range to create an understanding of composite functions. Young scholars learn to write composite functions...
Illustrative Mathematics
Introduction to Linear Functions
Introduce your algebra learners to linear and quadratic functions. Learners compare the differences and relate them back to the equations and graphs. Lead your class to discussions on the properties of a function or a constant slope...
West Contra Costa Unified School District
Introduction to Inverse Functions
Ready to share the beauty of the inverse function with your classes? This algebra II lesson guides the discovery of an inverse function through a numerical, graphical, and an algebraic approach. Connections are made between the three,...
Willow Tree
Functions
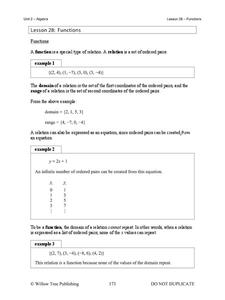
What makes a function a function? Learn the criteria for a relation defined as a function both numerically and graphically. Once young mathematicians define a function, they use function notation to evaluate it.
Other popular searches
- Math Functions
- Math Functions Quadratic
- Math Functions Domain Range
- In/out Math Functions
- Math Functions and Patterns
- Math Functions Egg Carton
- Math Functions Spaghetti
- Math Functions Bridge
- Math Functions Rounding
- Composite of Math Functions
- Math Functions Quadractic
- Math Parent Functions


