West Contra Costa Unified School District
Graphing Exponential Functions
Once you know how to graph y = b^x, the sky's the limit. Young mathematicians learn to graph basic exponential functions and identify key features, and then graph functions of the form f(x) = ab^(x – h) + k from the function f(x) = b^x.
West Contra Costa Unified School District
Graphing Family of Functions
Functions have families, too. Learners first graph the parent functions for linear, quadratic, and cubic functions, and then use vertical translations to graph families of functions.
Illustrative Mathematics
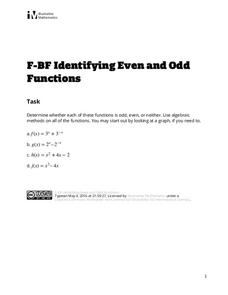
Identifying Even and Odd Functions
Is it even ... or odd? The task provides four functions to identify as being even, odd, or neither. Pupils use algebraic methods to make their decisions with select exponential, quadratic, and cubic functions.
Shodor Education Foundation
Multi-Function Data Flyer
Explore different types of functions using an interactive lesson. Learners enter functions and view the accompanying graphs. They can choose to show key features or adjust the scale of the graph.
Concord Consortium
Rational and Not So Rational Functions
Do not cross the line while graphing. Provided with several coordinate axes along with asymptotes, pupils determine two functions that will fit the given restrictions. Scholars then determine other geometrical relationships of asymptotes...
Balanced Assessment
Function or Not?
Is it possible for an equation to be a function and not a function at the same time? By completing a short assessment, young mathematicians answer this question. Class members provide an explanation on how an equation represents a...
CPALMS
Writing an Exponential Function from its Graph
Grow an equation for the exponential graph. Given a graph of an exponential function, class members write the equation of the function provided. The graph labels two points on the graph: the y-intercept and the point where x is one.
Shodor Education Foundation
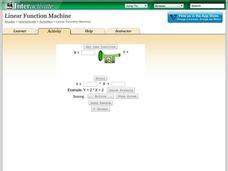
Linear Function Machine
What goes in must come out! Learners play with a function machine to determine the correct function. They enter input values and watch as the machine produces the output.
Concord Consortium
Functions by the Slice
Piece by piece ... dismantling a function can highlight interesting patterns. The task asks learners to slice functions in sections with the same vertical change. They then recreate the graph with these slices positioned horizontally....
West Contra Costa Unified School District
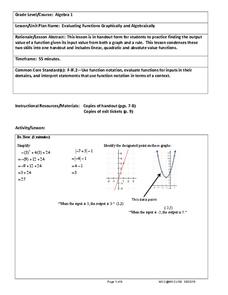
Evaluating Functions Graphically and Algebraically
High schoolers evaluate functions graphically and algebraically. After completing that step, they write a statement describing the input and output.
Curated OER
Mystery Liquids: Linear Function
High schoolers determine the linear equations of the density of water and oil by collecting data on the mass of various volumes of each liquid. They construct scatter plots from the data and use these to write the linear equations for...
Curated OER
A Sum of Functions
Collaborative learners will see the geometric addition of functions by graphing the sum of two graphed curves on the same coordinate plane. This task then naturally flows into giving learners the algebraic representation of the curves...
Radford University
Projectile Motion and Quadratic Functions
Model the flight of a ball. Small groups collect time data for how long it takes to toss a ball between two people. The teacher leads a discussion about projectile motion to get the class thinking about how to calculate the equation of...
Curated OER
Exercise Set 2.6: An Introduction to Functions
In this functions learning exercise, students solve 70 short answer questions. Students find domain of functions and evaluate them for a given value. Students determine if a mapping diagram represents a function.
Curated OER
Rational Functions
In this college level Pre-Calculus activity students evaluate rational functions, identify the domain, vertical asymptotes, and x- and y-intercepts. The three page activity contains forty problems. Answers are provided.
EngageNY
Exploring the Symmetry in Graphs of Quadratic Functions
Math is all about finding solutions and connections you didn't expect! Young mathematicians often first discover nonlinear patterns when graphing quadratic functions. The lesson begins with the vocabulary of a quadratic graph and uses...
Illustrative Mathematics
Foxes and Rabbits 2
The fox population chases the rabbit population. Groups model the populations of foxes and rabbits with two trigonometric functions. Individuals graph both trigonometric models on the same graph, and then teams determine an explanation...
Illustrative Mathematics
Foxes and Rabbits 3
Model periodic populations. Here, in the context of foxes and rabbits, pupils look at graphs of the populations of these animals in a national park over a span of 24 months. Groups analyze the graphs and determine trigonometric...
K20 LEARN
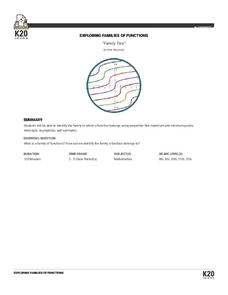
Family Ties: Exploring Families OF Functions
They say it runs in the family. Small groups use a card sorting activity to group graphs of functions into families. After grouping by families, the class develops conclusions for parent functions and create a graphic organizer.
EngageNY
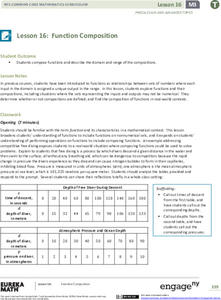
Function Composition
Combine functions for the first time. Pupils investigate composition of functions using a function table and then function machines in the 17th installment in a 23-part Precalculus series. Scholars learn the two notations for composition...
CK-12 Foundation
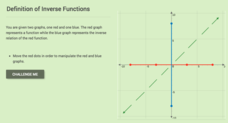
Inverse Functions: Definition of Inverse Functions
Is the inverse of a function also a function? Pupils manipulate the graph of a function to view its inverse to answer this question. Using a horizontal and vertical line, class members determine whether the initial function is...
CK-12 Foundation
Definition of Inverse Functions
Investigate the definition of inverse functions graphically. Using the interactive, scholars create a graph of a function and view its resulting inverse. They then determine whether a group of functions have inverses that are also...
EngageNY
Transforming Rational Functions
Move all rational functions—well, maybe. Learners investigate the graphs of the reciprocals of power functions to determine a pattern between the graph and the power. Pupils graph rational functions where transformations are clearly...
CK-12 Foundation
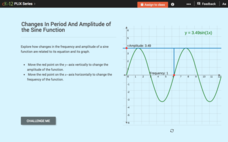
Changes in Period and Amplitude of the Sine Function
How does a change in amplitude or period affect the equation of a sine function? Scholars move sliders to change the frequency and period of the sine function. The interactive displays the resulting equation, and pupils determine the...
Other popular searches
- Math Functions
- Math Functions Quadratic
- Math Functions Domain Range
- In/out Math Functions
- Math Functions and Patterns
- Math Functions Egg Carton
- Math Functions Spaghetti
- Math Functions Bridge
- Math Functions Rounding
- Composite of Math Functions
- Math Functions Quadractic
- Math Parent Functions


