Curated OER
Probability
Third graders conduct experiment, collect data, predict, record, and discuss outcomes, and analyze data for probability.
Curated OER
Are There Too Many Elk?
Students study elk populations in Arizona. In this data lesson students read an article on monitoring elk populations, analyze data and make management recommendations.
Pennsylvania Department of Education
Use Order of Operations to Evaluate Expressions—No Grouping Symbols
Students identify and explain different types of data collection and graphs. For this graphs and data collection lesson, students record their observations of a variety of data collection tools and graphs displayed in the room. Students...
Curated OER
The Game is Afoot - A Study of Sherlock Holmes
Mystery is an exciting genre for young readers to investigate. The plots are so intriguing! Here is a series of lessons featuring Sherlock Holmes stories that invite learners to enter the world of the mystery genre. Based on what they...
Curated OER
Probability- Based Bingo Lesson Plan
Statisticians play a game of Bingo to discover the meaning of probability. They are given 12 markers to distribute across the numbers 1-12 on their playing mat. As a pair of dice is rolled, markers are removed from the playing mat. The...
National Museum of Nuclear Science & History
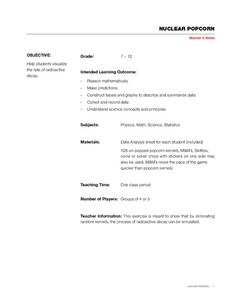
Nuclear Popcorn
Make your lesson on radioactive decay pop with this lab exercise. Using popcorn kernels spread over a tabletop, participants pick up all of those that point toward the back of the room, that is, those that represent decayed atoms. As the...
Curated OER
How to Graph in Excel
Fourth graders construct data graphs on the Microsoft Excel program. In this statistics instructional activity, 4th graders formulate questions and collect data. Students represent their results by using Excel.
University of California
Seasons Lab Book
Unlock the mystery behind seasonal change with a collection of worksheets and activities. Whether they are drawing pictures of Earth's orbit around the sun or graphing the temperature and daylight hours of different locations from around...
DK Publishing
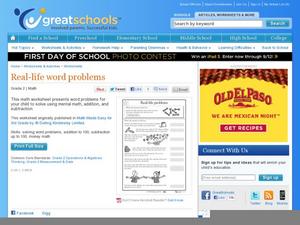
Real-Life Word Problems
Prepare your second graders for word problems with a straightforward review worksheet. Use it after a unit on addition and subtraction up to 100, or after you have worked on money math. A sample word problem prompts young learners to...
Discovery Education
Sonar & Echolocation
A well-designed, comprehensive, and attractive slide show supports direct instruction on how sonar and echolocation work. Contained within the slides are links to interactive websites and instructions for using apps on a mobile device to...
Cheetah Outreach
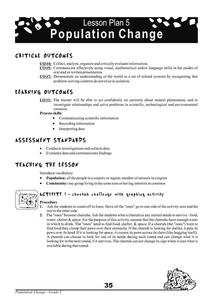
Population Change
Your youngsters become cheetahs in search of food, water, shelter, and space in a fun physical game that does a fantastic job of representing fluctuating species population based on resources available over years.
Science 4 Inquiry
Deforestation
Young scientists observe deforestation from satellite photos and discuss the importance of forests to the global environment. They then simulate a plot of forest when farmers move into the area over the course of seven years. Finally,...
Creative Learning Exchange
The Infection Game: The Shape of Change
Encourage the spread of knowledge in your class with this cross-curricular epidemic simulation. Pulling together science, social studies, and math, this lesson engages students in modeling the spread of infectious diseases, collecting...
Curated OER
Cars on the Curve
Second graders, using two dice, participate in a car race game called Cars on the Curve. They predict which car wins the game and records it in their Data Diary.
Curated OER
How Do We Solve the Problem of Wildlife on Our Roads?
Students analyze data on elk ecology and movements across the highway. In this ecology lesson, students research ways to save them from highway collisions. They write a report and present their findings in class.
Curated OER
Chances Are
Upper graders examine the concept of probability. They collect data and create a bar graph. They must interpret the data as well. Everyone engages in hands-on games and activities which lead them to predict possible outcomes for a...
Center Science Education
Plugged In To CO2
Watt is going on here? Middle schoolers are learning about energy use and carbon dioxide emissions! In the first part of this lesson, learners measure how much energy different appliances consume and calculate the amount per day. In the...
Curated OER
Chart This!
Learners collect and analyze data. In this middle school mathematics lesson, students collect data on three to four traits or favorites. Learners analyze their data and create a chart of graph for each trait or favorite they researched.
Alabama Wildlife Federation
Big Fish, Little Fish
Tag, you're eaten! A instructional activity on predator-prey relationships uses the game freeze tag as a model. Learners become either a predator or prey and play a game of tag as the prey tries to reach areas that house food and...
Curated OER
A Taste of Our Classroom
Students explore their classroom tastes. In this lesson plan, students list the four tastes that the tongue can detect, map the individual areas of taste on the tongue, and demonstrate the ability to identify objects through the use of...
Curated OER
Recycling - A Job Everyone Can Do
Young scholars research recycling effort that take place in the US. They play an online game and complete handouts using Internet research.
Curated OER
Star Wars: Rays and Angles Edition
Rays and angles and Star Wars? It sounds strange, but it's actually a fun game to help fourth graders get good at measuring and identifying angles and rays with a protractor. Each pair of children chooses which Star Wars character they'd...
Curated OER
Chalkboard Challenge: 5th Grade Math Review
This math review PowerPoint engages fifth grade students in an interactive review of math concepts. This review game includes questions on numeration, data interpretation and number theory. This is in a "Jeopardy" style format.
Curated OER
Excel for Beginners
In this Excel lesson, learners set a formula to check their homework. Students also use clipart, work in groups, and learn to use the tools in the drop-down list.


