Curated OER
Range, Cluster, Gap and Outliers
There are a number of activities here where learners collect and record data, as well as, activities where the likelihood of an event happening is calculated given the experimental probability. Young statisticians organize information...
Curated OER
Line Plots
In this line plot worksheet, students create a line plot of given data. They identify the range, clusters, gaps, and outliers. This one-page worksheet contains 8 multi-step problems.
Radford University
A Change in the Weather
Explore the power of mathematics through this two-week statistics unit. Pupils learn about several climate-related issues and complete surveys that communicate their perceptions. They graph both univariate and bivariate data and use...
Curated OER
How's The Weather?
Students make a box and whiskers plot using the TI-73 graphing calculator. Each student would have their own calculator but they would work in small groups of two or three to help each other enter the data and make the plots.
Curated OER
Height versus Shoe Size
Middle schoolers find a correlation between a person's height and his/her shoe size. They have access to entering data into lists on a graphing calculator and can complete scatter plots. Students read and interpret a scatter plot and use...
Khan Academy
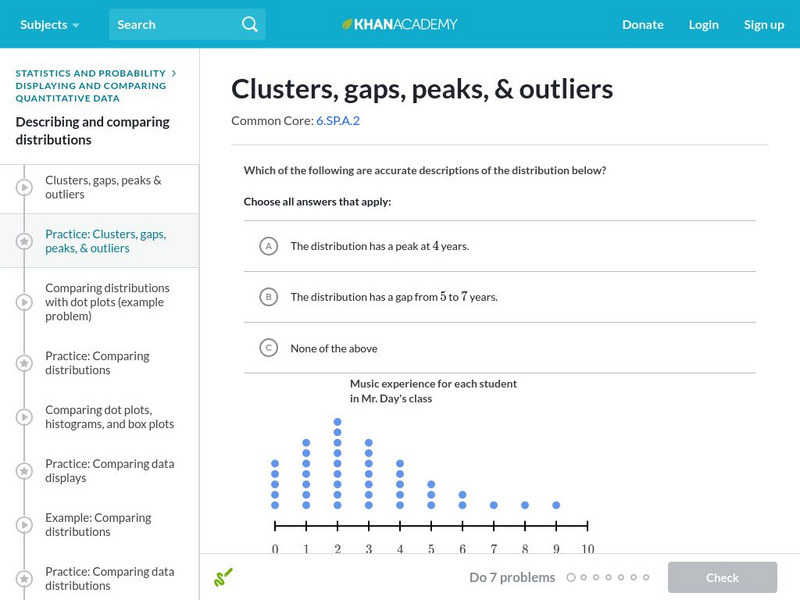
Khan Academy: Clusters, Gaps, Peaks, and Outliers
In this exercise, students practice describing data distributions as clusters, gaps, peaks, and outliers. Students receive immediate feedback and have the opportunity to get hints and try questions repeatedly.
Khan Academy
Khan Academy: Clusters, Gaps, Peaks, & Outliers
Practice some nifty new vocab for describing data distributions. Students receive immediate feedback and have the opportunity to try questions repeatedly, watch a video or receive hints.
Other
Northern Michigan University: Line Plots
The author utilizes a line plot to demonstrate what an "outlier" is, what "clusters" are, and what "gaps" are.


