Curated OER
Impossible Graphs
Students practice plotting functions on the Cartesian coordinate plane while participating in a discussion about the Possible Or Not worksheet/activity. Students also use the Impossible Graphs worksheet to practice reading a graph,...
Curated OER
Visualizing Vectors
Investigate vectors in standard positions and use the CellSheet application on the TI calculator to find the sum of two vectors. Convert from polar to rectangular coordinates and vice versa, and show graphs of the vectors.
Bytes Arithmetic
Geometry Pad+
Graphing paper, pencil, ruler, protractor, and compass, all get replaced or supplemented with this dynamic geometry application. Here, you can create, move, and scale many different shapes, as well as, explore and change their properties...
Curated OER
Graph Figures From Equations
Students explore the concept of graphing figures from equations. In this graphing lesson, students use Microsoft Math to graph figures from equations and write equations from graphed figures.
Curated OER
Exploring Area/Perimeter Through Coordinate Geometry
Students explore area and perimeter through coordinate geometry using student literature, hands-on manipulatives, and the Internet.
Curated OER
Graphing a Triangle
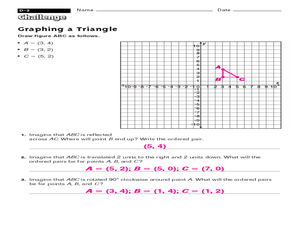
In this geometry skills worksheet, students graph a triangle using the provided information and then respond to 3 short answer questions regarding it.
EngageNY
Searching a Region in the Plane
Programming a robot is a mathematical task! The activity asks learners to examine the process of programming a robot to vacuum a room. They use a coordinate plane to model the room, write equations to represent movement, determine the...
Curated OER
Let's Plot Points
Use coordinate grid paper to plot points and identify shapes that are already plotted on the paper by saying their coordinates. Pupils also measure the distance between points and play the game Battleship. There are several web links and...
Curated OER
Slope, Vectors, and Wind Pressure
A hands-on lesson using the TI-CBR Motion Detector to provide information to graph and analyze. The class uses this information to calculate the slope of motion graphs and differentiate scalar and vector quantities. There is a real-world...
Curated OER
Point Reflection
Use this task as an exit ticket for your eight graders during the geometry unit. All they need to do is identify the coordinates of a point reflected over y=2000.
Texas Instruments
Complex Numbers: Plotting and Polar Form
Explore the concept of, and use the Ti-Nspire to, convert complex numbers into polar form. Then practice graphing complex numbers in the polar coordinate plane.
Curated OER
Profitable Soda Stand
Am I making any money? Help learners determine if their fictitious soda stand is turning a profit. They graph linear equations using the slope and y-intercept and identify the best price to use to sell soda. They identify the domain and...
Curated OER
Barbie Bungee
Middle and high schoolers collect and analyze their data. In this statistics lesson, pupils analyze graphs for linear regression as they discuss the relationship of the function to the number of rubber bands and the distance of the...
CK-12 Foundation
Horizontal and Vertical Line Graphs
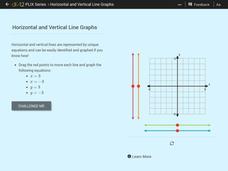
See how vertical and horizontal lines have special equations. Scholars drag vertical and horizontal lines onto a coordinate plane to graph given equations. They then answer a set of challenge questions on the topic.
CK-12 Foundation
Graphs of Linear Functions: Line Designs
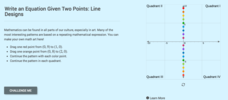
Designs from lines are sublime. Scholars create colorful designs by connecting points on an interactive coordinate plane. They answer questions about slope and quadrants based on their designs.
Virginia Department of Education
Transformations
The coordinate plane is a popular place! Identify rotations, reflections, and dilations on the coordinate plane. Pupils work in small groups to match transformations of a figure with the description of the transformation. They perform...
Curated OER
Compound Inequalities and Graphing
Put geometry skills to the test! Learners solve compound inequalities and then graph the inequalities on a coordinate plane using their geometric skills. They identify the slope and y-intercept in order to graph correctly. I like this...
Agile Mind
Transforming Graphs of Quadratic Functions
In the activity on this webpage, learners use interactive graphing technology to investigate transformations of graphs. In the first part of the task, they look at the graph of a quadratic function with coordinates of a few points...
Curated OER
Exploring Quadratic Data with Transformation Graphing
Using a data collection device to collect data regarding a bouncing ball, students use various features on graphing calculators to experiment with the parameters of the vertex form of the parabola and their effect on the shape of the...
Curated OER
Graphing Systems of Inequalities
Solve equations and graph systems of inequalities. Designed as a lesson to reinforce these concepts, learners revisit shading and boundaries along with solving linear inequalities.
Curated OER
Discovering PI
In this pi worksheet, students identify and complete 4 different problems that include pi and graphing data points. First, they complete the chart at the top by measuring the diameter and circumference of each object. Then, students plot...
Curated OER
Coordinate Geometry
In this Algebra I instructional activity, 9th graders identify and graph points on a coordinate plane, determine the x-and y-intercepts of a linear equation, and graph linear equations. The six page instructional activity contains...
Curated OER
Area on a Coordinate Grid
In this area on a coordinate grid worksheet, students solve and graph 10 different problems on a coordinate grid. First, they determine the area of the given figures in each. Then, students determine the length of each side of the...
Curated OER
Finding Coordinates on a Grid
In this finding coordinates on a grid worksheet, 3rd graders write the name of the shape that corresponds to eight given coordinates.


