National Geographic
National Geographic: The Politics of Place Naming
Learners use an online geographic information system (GIS) to uncover the geographic and social context of streets named after Martin Luther King, Jr. They map street locations to identify regional patterns in honoring King, consider...
Science Education Resource Center at Carleton College
Serc: Using Gis to Map Emergency Response to Municipal Flooding
In this lesson students will work with municipal data and computer mapping to determine the priorities of emergency response to flooding in a local town. This can be used as a lab activity or as a group or individual project, and can be...
Science Education Resource Center at Carleton College
Serc: Detecting El Nino in Sea Surface Temperature Data
Through data analysis and observations of patterns, students learn about normal seasonal sea surface temperature variation as well as extreme variation, as in the case of El Nino and La Nina events, in the equatorial Pacific Ocean.
Science Education Resource Center at Carleton College
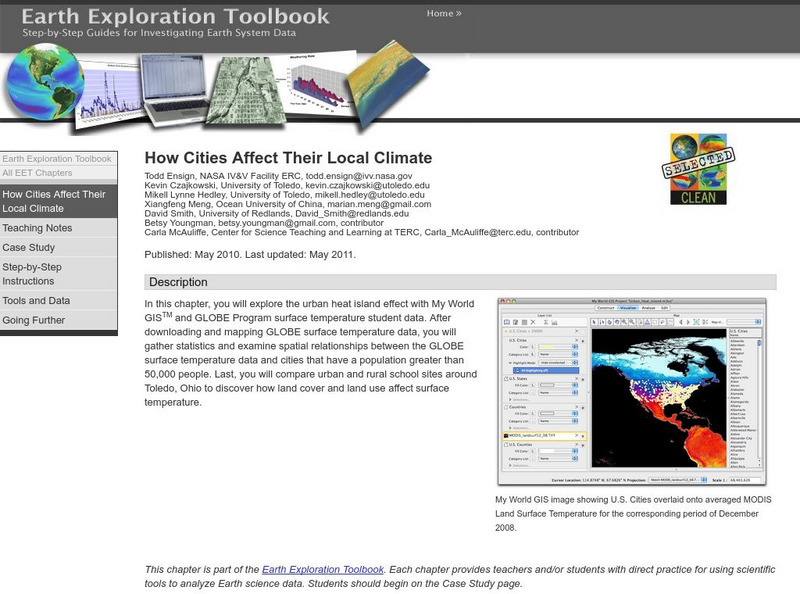
Serc: How Cities Affect Their Local Climate
Students explore the urban heat island effect with My World GISTM and GLOBE Program surface temperature student data. After completing this chapter, students will be able to successfully download GLOBE Program datasets in the...
Science Education Resource Center at Carleton College
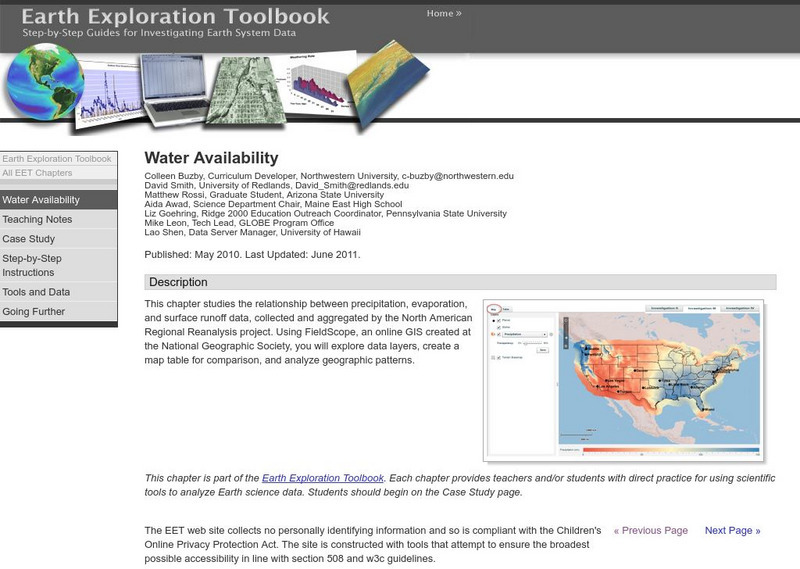
Serc: Water Availability
This lesson helps young scholars discover the relationship between precipitation, evaporation, and surface runoff data. Using FieldScope, an online GIS created at the National Geographic Society, students will explore data layers, create...


