Science Education Resource Center at Carleton College
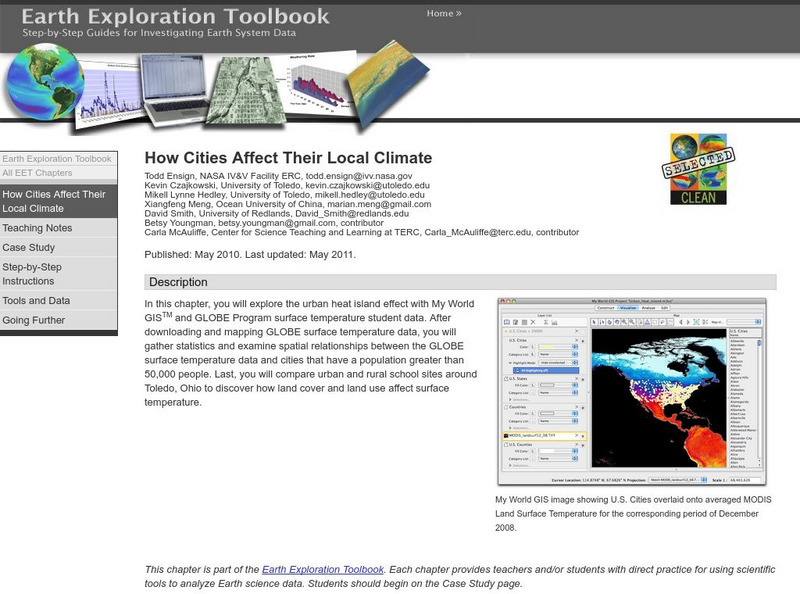
Serc: How Cities Affect Their Local Climate
Students explore the urban heat island effect with My World GISTM and GLOBE Program surface temperature student data. After completing this chapter, students will be able to successfully download GLOBE Program datasets in the...
US Geological Survey
U.s. Geological Survey
The U.S. Geological Survey reports on the latest news affecting the earth today, as well as providing a wealth of data, reports, and information.
Science Education Resource Center at Carleton College
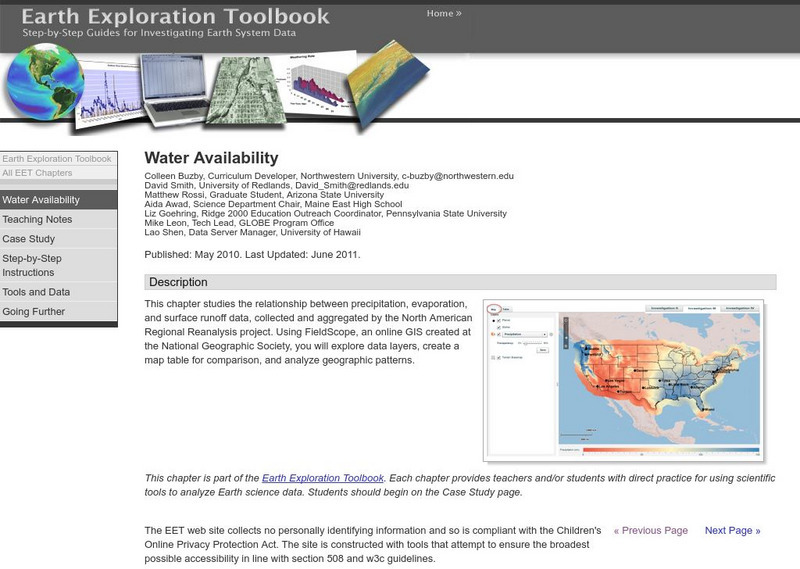
Serc: Water Availability
This lesson helps young scholars discover the relationship between precipitation, evaporation, and surface runoff data. Using FieldScope, an online GIS created at the National Geographic Society, students will explore data layers, create...
Other
Ggmap: Spatial Visualization With Ggplot2 [Pdf]
In spatial statistics the ability to visualize data and models super imposed with their basic social landmarks and geographic context is invaluable. ggmap is a new tool which enables such visualization by combining the spatial...
TeachEngineering
Teach Engineering: Where Are the Plastics Near Me? (Field Trip)
An adult-led field trip allows students to be organized into investigation teams that catalogue the incidence of plastic debris in different environments. These plastics are being investigated according to their type, age, location and...
Science Education Resource Center at Carleton College
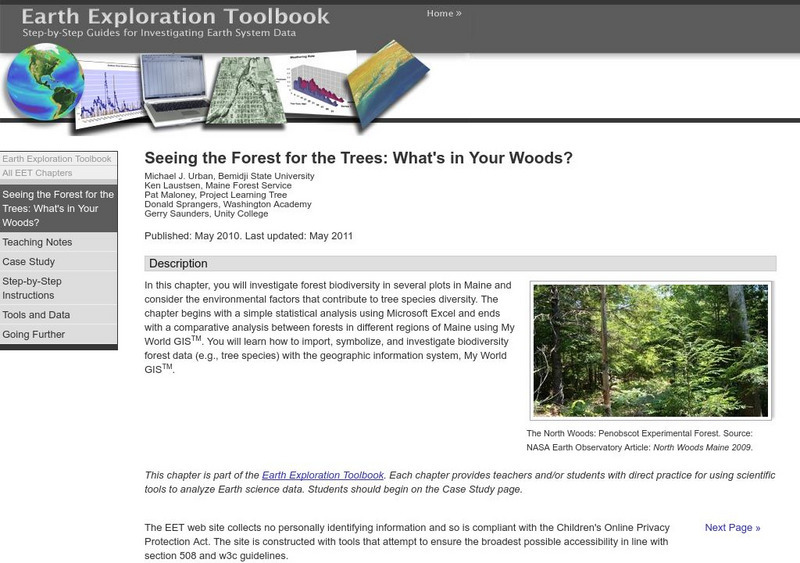
Serc: Seeing the Forest for the Trees: What's in Your Woods?
In this learning module, students will look at the state of forest biodiversity in Maine, and what conditions lead to greater species diversity of trees. They will use geographic data from different regions of Maine to compare forest...


![Ggmap: Spatial Visualization With Ggplot2 [Pdf] Article Ggmap: Spatial Visualization With Ggplot2 [Pdf] Article](https://d15y2dacu3jp90.cloudfront.net/images/attachment_defaults/resource/large/FPO-knovation.png)

