Teach Engineering
What is GIS?
Is GIS the real manifestation of Harry Potter's Marauders Map? Introduce your class to the history of geographic information systems (GIS), the technology that allows for easy use of spatial information, with a resource that teaches...
Teach Engineering
Searching for Bigfoot and Others Like Him
Individuals create a GIS data layer in Google Earth that displays information about where one might find seven different cryptids. The class members research to find data on cryptid sightings they can include in their data...
Curated OER
Matrix Analysis of Networks
Explore the connection between a finite graph, a directed graph, and a matrix. Graph lines and identify the relationship of matrices in real-world scenarios. Then use this information to work with a partner to plan and design a...
Curated OER
Graphing and Analyzing Biome Data
Students explore biome data. In this world geography and weather data analysis lesson, students record data about weather conditions in North Carolina, Las Vegas, and Brazil. Students convert Fahrenheit degrees to Celsius degrees and use...
Teach Engineering
Projections and Coordinates: Turning a 3D Earth into Flatlands
Introduce your class to map projections and coordinates, the basics for the work done in a GIS, with an activity that uses Google Earth to challenge learners to think about the earth's shape.
Curated OER
Teaching Modeling Water Quality
Students explore the basics of interpreting RUSS temperature and oxygen profile data. They are introduced to the Geographic Information Systems (GIS), particularly with respect to interpreting maps.
Curated OER
Risk Assessment and Geometry
Tenth graders study the concept of risk analysis as it relates to geometry. In this spatial relationship lesson, 10th graders are provided a set of coordinates to analyze a piece of land described. Students write a description that...
Curated OER
Mathematical Modeling
Study various types of mathematical models in this math lesson. Learners calculate the slope to determine the risk in a situation described. They respond to a number of questions and analyze their statistical data. Then, they determine...
Curated OER
How High Is That?
Students explore the National Spatial Reference System. In this vertical position lesson plan, students will discuss the use of vertical position data and solve practical problems involving geographic positioning.
Curated OER
Re-Presenting Race in the Digital Age
Teen-aged scientists analyze a graphic organizer of how trash is removed from New York City and then answer standard questions about a graph and a diagram. Resources are mentioned, but there are no links to these resources, so you will...
Curated OER
Do You Have a Sinking Feeling
Students determine how marine archaeologists use historical and archaeological data to draw inferences about shipwrecks. Students plot the position of a shipwrecked vessel, and draw inferences about the shipwreck from artifacts that have...
Curated OER
Show Me the Way To Go Home
Students place a pencil perpendicular to the ground and trace its shadow between 11:30 AM and 12:30 PM. They measure the length of the shadow, periodically over several hours, in either English or Metric units. Using the data, they find...
Teach Engineering
What's Wrong with the Coordinates at the North Pole?
Here is an activity that merges technology with life skills as individuals use Google Earth to explore the differences between coordinate systems and map projections. The self-guided worksheet is the fourth segment in a nine-part unit....
Curated OER
Is the Hudson River Too Salty to Drink?
Students explore reasons for varied salinity in bodies of water. For this geographical inquiry lesson, students use a variety of visual and written information including maps, data tables, and graphs, to form a hypothesis as to why the...
Curated OER
The Grand Excursion GPS Map
Eighth graders investigate the uses of a global positioning system. They create waypoints and have to find them using the system. Students must review the geographical concepts of latitude and longitude. The media requirements of the...
Curated OER
A Contouring We Go
Students examine the built environment and infrastructures of their community by constructing contour equipment, using the equipment, and comparing their results to current topographical maps of the same area
Curated OER
In the Wake of Columbus
Students explore how the population decreased in native cultures.
Curated OER
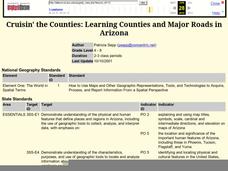
Cruisin' the Counties: Learning Counties and Major Roads in Arizona
Young scholars examine Arizona counties and use the themes of location and movement to develop an Arizona map.
Curated OER
What Are We Going To Do About Baby Six Billion?
Students formulate and evaluate suggestions about government policy using demographic examples and projections. They examine websites and utilize worksheets imbedded in this plan.
Curated OER
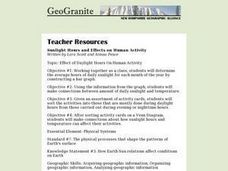
Effect of Daylight Hours on Human Activity
Students determine the average hours of daily sunlight for each month of the year by constructing a bar graph. They develop a understanding of how the amount of daylight hours varies by month and how that affects both temperature and...


