Curated OER
Hagerman GIS Questions
Students examine maps and pictures to identify specific geographic information. In addition, they explore data tables and GIS data to identify fossil beds and vegetation. Students explore the correlations between soil type, vegetation,...
Curated OER
Looking into Earth with GIS
Students work with data from a seismic wave model in a freely available GIS (geographic information system) program, ArcVoyager SE. Using a GIS, they examine maps and produce graphs to explore variations in seismic wave velocities at...
Curated OER
Who's Range is it?
Students investigate the habits of panthers by analyzing radio transmitted data. In this animal life lesson, students utilize computers to view the range of different statistics dealing with Florida panthers. Students complete a...
Curated OER
Fractile vs. Equal
Students compare and contrast methods of categorizing data. In this data collection instructional activity, students complete worksheet activities that require them to note the differences between equal and fractile intervals. Students...
Curated OER
Floodplains in the field (with GIS)
Students measure a topographic and geologic cross-section across a floodplain by simple surveying and auguring techniques. They consider the spatial context of the field observations, use GPS measurements, and desktop GIS analyses.
Curated OER
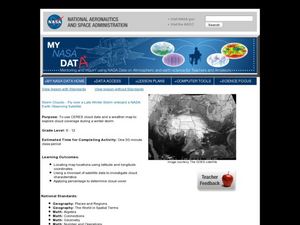
Storm Clouds-- Fly over a Late Winter Storm onboard a NASA Earth Observing Satellite
Students study cloud data and weather maps to explore cloud activity. In this cloud data lesson plan students locate latitude and longitude coordinates and determine cloud cover percentages.
Curated OER
Teaching Modeling Water Quality
Students explore the basics of interpreting RUSS temperature and oxygen profile data. They are introduced to the Geographic Information Systems (GIS), particularly with respect to interpreting maps.
Curated OER
Weather Pals
Students study maps of the United States to locate weather pals from a list of schools. They communicate with Weather Pal schools through the use of closed circuit TV. Using weather data collected in their area, they exchange the...
Curated OER
Stream Gages and GIS
students interpret recent regional-scale climate events based on current stream flow, monitor changes in time, and to consider additional interpretations that could be derived if other data were in map form.
Curated OER
Climographs
Students identify trends and characteristics of climate zones and specific places within. Then, they graph annual climate trends (primarily Temperature and Precipitation) and create, interpret and extrapolate information based on...
Messenger Education
Look But Don’t Touch—Exploration with Remote Sensing
Mars is home to the tallest mountain in our solar system, Olympus Mons. In this set of two activities, learners review geologic land formations through the analysis of aerial maps. They then apply this knowledge to aerial maps of objects...
Curated OER
Hurricanes and Climate
Students investigate maps and data to learn about the connections between hurricanes and climate. In this exploratory lesson students describe and graph the 6 regions where hurricanes happen and discuss how hurricanes have changed over...
Curated OER
Exploring Climate Change with GIS
Students investigate climatological changes that are occurring to the Earth. In this climate change lesson, students access an assigned web site to view maps and lessons that show how climate change makes a difference to life on Earth.
Curated OER
Introducing Topographic Maps: Guiding Students from Concrete Models to Graphic Representations
Young scholars interpret topographic maps and infer human activity as it is influenced by the landscape.
Curated OER
The Great MPA Debate
Students study the 'Marine Protected Areas' process. In this ocean lesson students work in groups, conduct research and present it to the class.
Curated OER
What in Our World Affects the Way People Live
Sixth graders study various maps that show geographical features and population. They compare the maps and make inferences about how various geographical features influence the population and human activities of an area.
Arizona Cooperative Extension
Geocaching
Using GPS units, small groups participate in a scavenger hunt to find an object that you have hidden. They use coordinates for stopping points along a pre-planned path to get to the final cache. This is a terrific activity to include in...
Curated OER
Park Problems
Students calculate park acreage and map the distribution of parks in Austin, TX using GIS. Students use a specific website to find the information.
Teach Engineering
What's Wrong with the Coordinates at the North Pole?
Here is an activity that merges technology with life skills as individuals use Google Earth to explore the differences between coordinate systems and map projections. The self-guided worksheet is the fourth segment in a nine-part unit....
Prairie Public Broadcasting
Egyptian Pyramids Virtual Field Trip!
A virtual field trip takes enthusiastic travelers to the pyramids of Giza. Using Google, scholars explore the grounds of the ancient pyramids found in Egypt then complete three worksheets: a photo analysis page, a reflection sheet, and a...
Curated OER
Mapping My Community
Ninth graders are introduced to GPS technology. They complete fieldwork as they visit a specific area of their community to identify and map types of land use in the surveyed area. They use the collected data to create a digital map.
Curated OER
World Cities of 5 Million or More
Students consult online resources to identify and map the world's largest cities and metropolitan areas. They analyze birth rates, settlement patterns and other demographic data and make predictions for the future. They write essays...
Curated OER
Is the Hudson River Too Salty to Drink?
Students explore reasons for varied salinity in bodies of water. In this geographical inquiry lesson, students use a variety of visual and written information including maps, data tables, and graphs, to form a hypothesis as to why the...
Curated OER
Mapping Population Changes In The United States
Students create a choropleth map to illustrate the population growth rate of the United States. They explore how to construct a choropleth map, and discuss the impact of population changes for the future.


