Inside Mathematics
Conference Tables
Pupils analyze a pattern of conference tables to determine the number of tables needed and the number of people that can be seated for a given size. Individuals develop general formulas for the two growing number patterns and use them to...
Federal Reserve Bank
Saving and Investing for the Long Term
Create savvy investors with an activity that uses an online resource to allow individuals to invest in the stock market. The teacher is able to track activity and progress. Stock tips and strategies are shared.
Teach Engineering
Android App Development
Building an accelerometer app for your Android device. Groups develop an app that uses the accelerometer on an Android device. The purpose of the activity is to reinforce the programming design. The post activity assessment challenges...
Curated OER
Candy Machine
Using the concept of a candy vending machine, young mathematicians explore the sugar ratios found in different types of candy. Using the provided information, class members calculate and compare different ratios in order to find the...
Inside Mathematics
Population
Population density, it is not all that it is plotted to be. Pupils analyze a scatter plot of population versus area for some of the states in the US. The class members respond to eight questions about the graph, specific points and...
Balanced Assessment
Tie Breaker
Develop a tie-breaking policy to determine a league champion. The assessment presents a scenario of finding a champion of a league with three teams tied. Pupils devise and defend a system that allows for only one team to be determined...
Book Units Teacher
Skill Lessons – Prefixes and Suffixes
Sometimes the best way to understand a concept is to break it down. Young vocabulary pupils work with word parts in a hands-on activity that prompts them to connect flash cards with affixes to their root and base words. Additionally,...
EngageNY
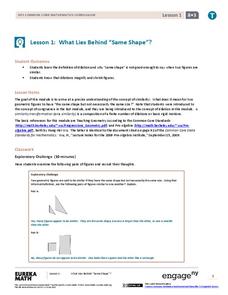
What Lies Behind “Same Shape”?
Develop a more precise definition of similar. The lesson begins with an informal definition of similar figures and develops the need to be more precise. The class learns about dilations and uses that knowledge to arrive at a mathematical...
EngageNY
Fundamental Theorem of Similarity (FTS)
How do dilated line segments relate? Lead the class in an activity to determine the relationship between line segments and their dilated images. In the fourth section in a unit of 16, pupils discover the dilated line segments are...
International Technology Education Association
Dampen That Drift!
The spacecraft is drifting too far off course! Two games help explain how a spacecraft can use its thrusters to maintain its position. The games have pupils be the components of vectors in order to create and counteract the disturbances.
Messenger Education
Design Challenge: How to Keep Items Cool in Boiling Water
Keeping items cool in boiling water... what? This engaging activity challenges high school learners to build a container that keeps butter in a solid state when placing the container in boiling water. Groups use previous knowledge and...
EngageNY
Informal Proof of AA Criterion for Similarity
What does it take to show two triangles are similar? The 11th segment in a series of 16 introduces the AA Criterion for Similarity. A discussion provides an informal proof of the theorem. Exercises and problems require scholars to apply...
EngageNY
Mid-Module Assessment Task: Grade 8 Module 6
Make sure pupils have the skills to move on to the second half of the module with a mid-module assessment task. The formative assessment instrument checks student learning before moving on to the rest of the lessons in the unit.
EngageNY
The Graph of a Linear Equation—Horizontal and Vertical Lines
Graph linear equations in standard form with one coefficient equal to zero. The lesson plan reviews graphing lines in standard form and moves to having y-coefficient zero. Pupils determine the orientation of the line and, through a...
EngageNY
The Computation of the Slope of a Non-Vertical Line
Determine the slope when the unit rate is difficult to see. The 17th part of a 33-part series presents a situation that calls for a method to calculate the slope for any two points. It provides examples when the slope is hard to...
EngageNY
Some Facts About Graphs of Linear Equations in Two Variables
Develop another way to find the equation of a line. The lesson introduces the procedure to find the equation of a line given two points on the line. Pupils determine the two points from the graph of the line.
Mathematics Assessment Project
Modeling Motion: Rolling Cups
Connect the size of a rolling cup to the size of circle it makes. Pupils view videos of cups of different sizes rolling in a circle. Using the videos and additional data, they attempt to determine a relationship between cup measurements...
Illustrative Mathematics
Building a General Quadratic Function
Rewrite a quadratic function to easily see the transformations involved. The instructional task takes a general quadratic function and rewrites it into a form that shows the translations and scaling of the parent quadratic function. The...
Noyce Foundation
Cutting a Cube
Teach the ins and outs of the cube! A series of five K–12 level activities explore the make-up of the cube. The beginning lessons focus on the vocabulary related to the cube. Later lessons explore the possible nets that describe a cube....
Noyce Foundation
Cut It Out
Explore the mathematics of the paper snowflake! During the five lessons progressing in complexity from K through 12, pupils use spatial geometry to make predictions. Scholars consider a folded piece of paper with shapes cut out. They...
Virginia Department of Education
Permutations and Combinations
Counting is not all it adds up to be — sometimes it involves multiplying. The lesson introduces permutations and combinations as ways of counting, depending upon whether order is important. Pupils learn about factorials and the formulas...
EngageNY
Sampling Variability and the Effect of Sample Size
The 19th installment in a 25-part series builds upon the sampling from the previous unit and takes a larger sample. Pupils compare the dot plots of sample means using two different sample sizes to find which one has the better variability.
Noyce Foundation
Once Upon a Time
Examine the relationship between time and geometry. A series of five lessons provides a grade-appropriate problem from elementary through high school. Each problem asks learners to compare the movement of the hands on a clock to an angle...
Noyce Foundation
Measuring Up
Teach the basics of measurement and conversion with a five-lesson resource that builds an understanding of proportion and measurement conversion from elementary through high school. Initially, young scholars use ratios to determine soup...
Other popular searches
- Fitness Goals
- Academic Goals
- Career Goals
- Life Goals
- Educational Goals
- Health Goals
- Independent Reading Goals
- Long Term Educational Goals
- Goal Setting Lessons
- Student Goal Setting
- Educational Plans and Goals
- Goal Setting Worksheet


