Curated OER
Rosie's Walk
Learners use maps and globes to locate and describe locations, directions and scale. Using the maps, they identify man made or natural features of different environments. They practice using geographical terms to describe a specific...
Curated OER
A Bird's Eye View of our 50 States
Third graders focus on state birds as they learned absolute location (latitude/longitude) of each state, as well as their relative location (bordering states).
Curated OER
COLD SEA WATERS
Students examine how old sea waters affected the local and state area during the summer of 1998. Studying a detailed web-site helps students examine sea temperatures.
Curated OER
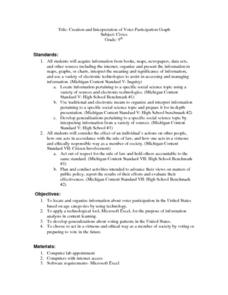
Creation and Interpretation of Voter Participation Graph
Ninth graders research information about voter participation in the United States based on age. They develop generalizations about voting patterns in the U.S and use Microsoft Excel to analyze the information.
Curated OER
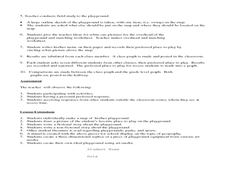
Where Oh Where on the Playground, Do I Love To Be?
Students listen to poem, Where Oh Where On the Playground, Do I Love to Be?, and practice reading, interpreting, and making maps, charts, and graphs in surveying classmates and discussing their favorite places to play in school playground.
Curated OER
Where In the World Are We?
Fifth graders read postcards and find their locations on maps. They use the pictures and text on the postcards to write about imaginary vacations. They compute the mileage and compare it to TripMaker data.
Curated OER
Take Me Out To the Ball Game
Students use a map to graph and locate major league teams of different sports. In groups, they analyze the population data of the United States and compare it with the amount and location of the major league teams. They share their...
Curated OER
Inference Lesson Plan
Students practice assessing graphics to infer and identify an author's implicit and explicit meaning in a piece of text. They evaluate the effectiveness of information found in maps, charts, tables, graphs, diagrams, cutaways and through...
Curated OER
The Seasonal Round and The Cycle of Life
Fourth graders are introduced to the concept of the seasonal round and how folklife traditions vary from season to season. They begin charting dates of personal interest on seasonal round calendars by starting with birthdays. Students...
Curated OER
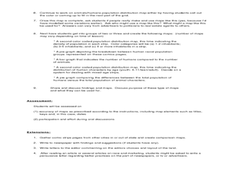
What is the Population Distribution of Cartoon Characters Living On the Pages of Your Newspaper?
Learners read various cartoons in their local newspaper and calculate the population demographics, spatial distribution and grouping of the characters. Using this information, they create a population distribution map and share them with...
Curated OER
Wet Water, Dry Land
Young scholars observe and examine relationship between landforms and bodies of water, recognizing differences between them. Students then define island, peninsula, isthmus, archipelago, lake, bay, straight, system of lakes, and identify...
Curated OER
Using "Why Mosquitoes Buzz in People's Ears" to Teach Cause and Effect
Students discuss cause and effect relationships and the chain reaction involved before listening to the story "Why Mosquitoes Buzz in People's Ears". Students create flow charts to show the chain reactions of causes and effects in the...
Curated OER
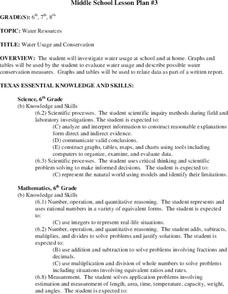
Water Usage and Conservation
Learners investigate water usage at school and at home. They use graphs and tables to evaluate water usage. Students describe possible water conservation measures. They use graphs and tables to relate data as part of a written report.
Curated OER
Comparison of Snow Cover on Different Continents
Learners use the Live Access Server (LAS) to form maps and a numerical text file of snow cover for each continent on a particular date. They analyze the data for each map and corresponding text file to determine an estimate of snow cover...
Curated OER
Different Perspectives of Oregon's Forest Economic Geography
Young scholars map data on employment in wood products manufacturing in Oregon counties. In this Oregon forest lesson plan, students discover the percentage of people employed in the forest manufacturing industry. Young scholars create a...
Curated OER
The Geographic Doctor Seuss
Students define the term region using semantic mapping, listen to the Dr. Seuss story Yertle the Turtle, and discuss the conflict over borders in the story. They draw a map divided into regions.
Curated OER
Wetlands: Pave or Save?
Students discuss the characteristics of wetlands and how to make them more productive. Using a map, they locate the major wetlands in the United States and color them using a key. They read an article and in groups answer discussion...
Curated OER
Louisiana Purchase
Students use maps to locate and describe the area purchased by the Louisiana Purchase. In groups, they write a letter to Thomas Jefferson in which they evaluate the topography, climate and geography of the land. They determine the land's...
Curated OER
Most Wanted Villians
Students review the characteristics of various characters in fairytales. As a class, they review the story details and create a concept map using a software program. They create their own wanted poster of the villians in the fairytale to...
Curated OER
Using Radiosonde Data From a Weather Balloon Launch
Student use radiosonde data from a weather balloon launch to distinguish the characteristics of the lower atmosphere. They learn the layers of the atmosphere. They graph real atmospheric data.
Curated OER
Trouble in the Troposphere
Students Use data sets from MY NASA DATA to produce graphs comparing monthly and yearly ozone averages of several U.S. cities. They analyze and evaluate the data and predict trends based on the data. In addition, they discuss and...
Curated OER
Simple machines
Students list and describe the six simple machines. They create a Thinking Map and outline using Kidspiration and create a paper on the importance of simple machines using Microsoft Word.
Curated OER
Trouble in the Troposphere
Young scholars create graphs using NASA data, compare ozone levels of several U.S. cities, analyze and evaluate the data and predict trends based on the data, and discuss and describe how human activities have modified Earth's air quality.
Curated OER
From Sea to Shining Sea
Students study the geography of the United States of America. Students write letters, create travel brochures, make maps, graph population numbers, read fiction and nonfiction selections, complete KWL charts, and watch films.
Other popular searches
- Maps Graphs and Charts
- Charts, Graphs, Maps
- Maps, Charts, Graphs, Tables
- Charts, Maps, Graphs
- Charts, Maps and Graphs


