Curated OER
Inequalities
In this inequalities instructional activity, 9th graders solve and complete 25 various types of problems. First, they determine the portion of the graph that should be shaded for each inequality. Then, students graph each system of...
Curated OER
Slope of a Line
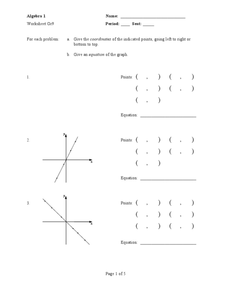
In this slope of a line worksheet, 9th graders solve and graph 10 different problems that include determining the slope of a line. First, they determine the slope of a line that contains two given points. Then, students determine the...
Curated OER
Simplifying Expressions
In this simplifying expressions activity, students solve and complete 41 various types of problems. First, they simplify each expression and write using exponents. Then, students graph each function and state the domain and range. They...
Curated OER
Scientific Notation
In this scientific notation worksheet, 9th graders solve and complete 6 different types of problems. First, they rewrite each in scientific notation. Then, students simplify the expressions given. They also solve each equation by...
Curated OER
Take Home Question – Chapter 4
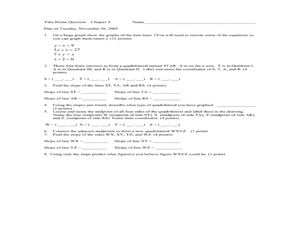
In this graphing linear equations worksheet, students solve 8 short answer and graphing problems. Students graph linear equations, find their points of intersection, find the slope of each line, identify the constructed quadrilateral, etc.
Curated OER
Boots
In this graphing practice instructional activity, 5th graders plot squares on a graph with an x and y axis. Once students locate each square they must color a certain design in that box to create a larger picture.
Curated OER
Slope, Intercepts, and Graphing a Line
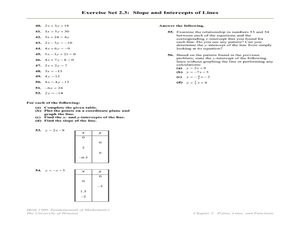
In this intercepts and slope worksheet, students find the slope and/or the x and y-intercepts in fifty-three problems. Students also graph lines using the x and y-intercepts.
Mt. San Antonio Collage
Test 2: Rationals, Exponentials, and Logarithms
Running out of logarithm questions in class? The nicely organized two-page worksheet provides practice in rational, logarithmic, and exponential functions. All the topics include graphing, solving, and finding domain and range.
Virginia Department of Education
Inequalities
Compare graphing an inequality in one variable on a number line to graphing an inequality in two variables on a coordinate plane. Young mathematicians work on a puzzle matching inequalities and their solutions. They then complete a...
Curated OER
Graph Study
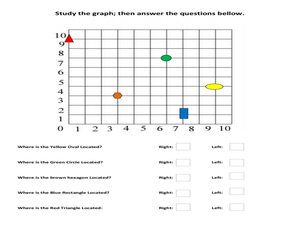
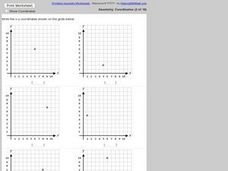
For this geometry skills worksheet, students examine a graph and respond to 5 questions that require them to identify the coordinate pairs of object on the grid.
Curated OER
Graphing
In this graphing worksheet, students solve and complete 8 different types of problems. First, they graph each set of axes completely. Then, students label the axes and shown a table of their results. In addition, they determine the cycle...
Curated OER
Graphs of Functions
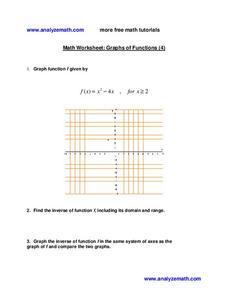
In this graphs of functions worksheet, 9th graders solve and complete 3 different types of problems. First, they graph function f given by the functions shown on the grid. Then, students find the inverse of a function including its...
Curated OER
TAKS 5th Grade Daily Upkeep 10
In this mathematics worksheet, students practice finding the coordinates found in the Cartesian graphing style for the three problems.
Curated OER
Trigonometry Worksheet: Graph Trigonometric Functions (1)
In this trigonometry activity, students graph one trigonometric function. The function is y=2cos(2x). A coordinate grid is included on the activity.
Curated OER
Plot the Coordinates to Create a Letter!
In this coordinates learning exercise, students plot and connect coordinates on graphs to create a letter, 2 graphs total. A reference web site is given for additional activities.
Curated OER
Coordinates and Equations
In this algebra worksheet, students solve linear equations and plot their results on the coordinate plane. There are 20 problems using slopes and intercepts to help graph linear equations.
Curated OER
Who's Hiding in Mike's Math Club Picture?
Learners use coordinates to complete the picture. They complete seven groups of coordinates and connect the dots to create an image.
Curated OER
Position, Velocity & Acceleration vs. Time Graphs
In this graphing worksheet, students determine the speed vs. time and acceleration vs. time plots based on the velocity vs. time graph given. Students complete 2 graphs.
CCSS Math Activities
Social Security Trust Fund
Will Social Security still be around when you retire? Given data on the predicted balance of the social security fund over time, scholars plot the points on a coordinate grid and determine if a quadratic regression fits the data. They...
Concord Consortium
Writing and Sketching I
Writing and sketching functions—what more could you want to do? Learners write and sketch functions that meet certain conditions as they complete a short task. They find a parabola that encompasses three quadrants of the coordinate plane...
Curated OER
Algebra II Test
In this algebra test, students must determine 3 definitions, match 4 equations to the answer, 4 short answer, and graph 4 points on a coordinate plane. There are 20 questions total.
Curated OER
Coordinates Graphing
In this geometry activity, students are given points to plot on a coordinate plane. They identify plotted coordinate pairs. There are 10 questions.
Curated OER
Worksheet 26
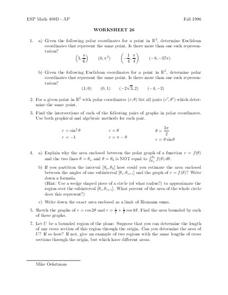
In this math worksheet, students use the polar coordinates to find the Euclidian coordinates. Then they compare points on the coordinate plane.
Curated OER
Domain and Range
In this domain and range learning exercise, students write the definitions for relation, function, domain and range. They then find the domain and range of 7 sets of ordered pairs. Finally, students answer 4 questions regarding inverse...


