BW Walch
Solving Systems of Linear Equations
Solving systems of equations underpins much of advanced algebra, especially linear algebra. Developing an intuition for the kinds and descriptions of solutions is key for success in those later courses. This intuition is exactly what...
EngageNY
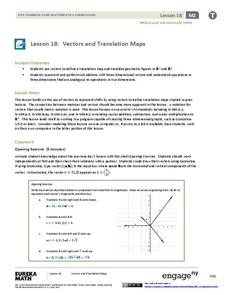
Vectors and Translation Maps
Discover the connection between vectors and translations. Through the lesson plan, learners see the strong relationship between vectors, matrices, and translations. Their inquiries begin in the two-dimensional plane and then progress to...
Shodor Education Foundation
Graphit
No graphing calculator? No worries, there's an app for that! Young mathematicians use an app to graph functions. In addition, they can also plot data points.
Curated OER
Introducing the Concept: Ordered Pairs
Students review ordered pairs. In this graphing lesson, students review ordered pairs with the teacher. This lesson includes a brief teacher script to help guide the students in understanding.
Curated OER
Transformations in the Coordinate Plane: Reteach
In this transformations activity, students review the terms and example diagrams for a translation, reflection, and rotation. Students then identify the coordinates for a triangle after completing the given transformations in the four...
Curated OER
A Sum of Functions
Collaborative learners will see the geometric addition of functions by graphing the sum of two graphed curves on the same coordinate plane. This task then naturally flows into giving learners the algebraic representation of the curves...
Curated OER
Hands On: Linear Equations
In this linear equation worksheet, 5th graders complete the equations, and fill in the function tables, before graphing the equation on the coordinate planes in 4 problems . They use equations with variables to solve 2 problems.
Curated OER
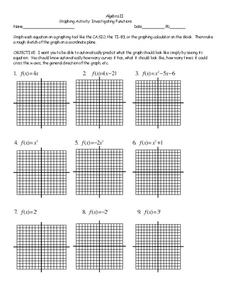
Function Investigation
In this functions learning exercise, 11th graders solve and complete 18 different problems. First, they graph each equation on the graphs provided, making a rough sketch on a coordinate plane. Then, students predict what each graph will...
Curated OER
Flips, Turns, and Slides: Adventures with Transformations
Learners explore transformations. For this math lesson, students plot points on a coordinate grid and construct shapes. Learners discuss movements on the grid as flips, turns and slides.
Curated OER
Investigating Functions
In this investigating functions activity, 11th graders solve and complete 18 different problems. First, they graph each equation on the graphs shown. Then, students make a rough sketch of graph on a coordinate plane. They also determine...
Curated OER
Handy Reflections
Learners explore reflections on a coordinate plane in this lesson plan. They trace their hand on a grid, determine the coordinates of each point, and create a scatter plot of their points. Pupils use this information to investigate...
Curated OER
Applications of Properties of Quadrilaterals in the Coordinate Plane
High schoolers explore the concept of quadrilaterals. In this quadrilaterals lesson, students use the slope formula, midpoint formula, and distance formula to justify that a given quadrilateral is a parallelogram.
Curated OER
Saving the Bald Eagle
Students plot on a coordinate plane. In this algebra instructional activity, students identify points on a coordinate plane and graph lines given coordinate pairs. They create a model as they study bald eagles and their growth and decay.
Curated OER
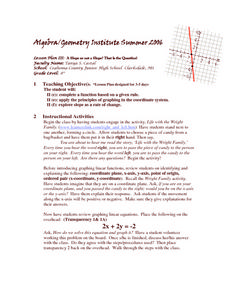
A slope or not a slope? That is the question.
Eighth graders investigate concepts related to Cartesian Coordinates. They use a creative game at the beginning of the lesson to identify quadrants by passing candy to one another. The rest of the lesson is using vocabulary and problem...
Curated OER
Constructing Tangrams
Seventh graders visualize and identify geometric shapes after applying transformations on a coordinate plane. In this tangrams lesson, 7th graders construct a set of tangrams and then answer extension questions related to measurement,...
Curated OER
Coordinate Geometry
In this Algebra I worksheet, 9th graders identify and graph points on a coordinate plane, determine the x-and y-intercepts of a linear equation, and graph linear equations. The six page worksheet contains nineteen problems. Answers are...
Curated OER
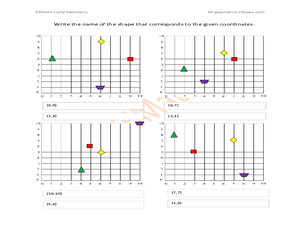
Finding Coordinates on a Grid
In this finding coordinates on a grid worksheet, 3rd graders write the name of the shape that corresponds to eight given coordinates.
Curated OER
Shapes and Coordinates
In this shapes and coordinates worksheet, students identify the shapes that are located and given coordinates on graphs. A reference web site is given for additional activities.
Curated OER
Plotting Points
In this plotting points worksheet, students are given eight points to plot on a coordinate plane. Afterward, they plot eight additional points and then translate the points according to given instructions. This one-page worksheet...
Curated OER
Linear Equations
In this linear equations learning exercise, 9th graders solve and complete 7 different problems that include a number of linear equations. First, they determine the slope given the points and then write an equation in slope-intercept...
Curated OER
Systems of Linear Inequalities
In this systems of linear inequalities worksheet, 9th graders solve and complete 10 various types of problems. First, they determine whether a given point is in the solution set of a system of linear inequalities. Then, students graph...
Curated OER
Inverse Functions
In this inverse functions instructional activity, 9th graders solve and graph 10 different problems that include the inverse of various functions. First, they determine if the coordinates given is the inverse of a function given. Then,...
Curated OER
Equations as Relations
In this equations as relations learning exercise, 10th graders solve and graph 9 different problems that include determining various ordered pairs. First, they determine the ordered pairs that are solutions to each equation. Then,...
Curated OER
Comparing Data on Graph A and Graph B
Second graders gather and graph data. In this graphing instructional activity, 2nd graders collect data and graph this information using tally charts, bar graphs, pictographs, or tables. They make predictions about the outcomes.


