Curated OER
Finding Slope of a Line
Students calculate the slope of a line. In this algebra lesson, students graph a line using the slope and y-intercepts. They define the steepness of the line using the slope.
Curated OER
Investigating Pythagorean Triples
Pupils investigate and solve Pythagorean triples. In this geometry lesson, students find the missing sides and angles of a right triangle. They graph right triangles and move the sides around to create different angles.
Curated OER
Modeling Population Growth
Students collect data on population growth. In this statistics activity, students graph their data and make predictions. They find the linear regression and the best fit line.
Curated OER
Line, Ray, Segment
Students define vocabulary words. In this geometry lesson, students identify the graph as a line, ray or segments. They understand the properties of each and calculate the distance on a number line.
Curated OER
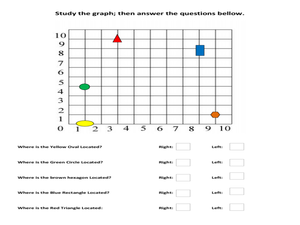
To The Right or Left?
In this right or left worksheet, students study a graph with colored shapes on it, then choose either right or left to tell where each shape is located.
Curated OER
A Wet Welcome Home
Students investigate data collection and analysis. In this Algebra I lesson plan, students create a scatter plot and find the equation of best fit in a simulation of a leaking water pipe.
Curated OER
Frequency Tables and Stem-and-Leaf Plots
Students are introduced to the function of frequency tables and stem and leaf plots. In groups, they determine the frequency of their teacher coughing, ringing a bell or raising their hand. To end the lesson, they determine frequency...
Curated OER
THE AREA OF A CIRCLE
Students examine the relationship between circumference and diameter and how to use the formula to find the area of a circle. In this circle lesson students divide into groups and complete an activity.
Curated OER
High School Mathematics Problems from Alaska: AL-CAN Highway Problem
Students write and solve equations converting between metric and standard measurement as they travel southeast on the Al-Can Highway.
Curated OER
High School Mathematics Problems from Alaska: Writing an Equation: Altitude Range vs. Day in Barrow, Alaska
Students answer questions about the altitude range of the sun over time in Barrow, Alaska.
Curated OER
Collecting And Fitting Quadratic Data
Students investigate the concept of using quadratic data to plot coordinates on a plane. They also apply the quadratic formula for a variety of problems with the help of a graphing calculator to draw the parabola for given coordinates.
Curated OER
You Can Find It!
Students locate different places including U.S. cities using longitude and latitude coordinates. In this longitude and latitude lesson plan, students locate 10 different locations.
Curated OER
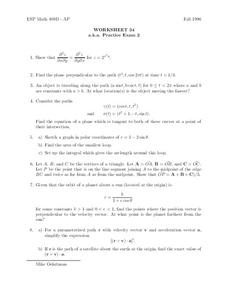
Worksheet 34
In this math activity, students find the plane perpendicular to the path (t2, t, cos 2πt) at time t = 1/4. Then they determine the location in which the object is moving the fastest.
Curated OER
Measurement and the Illampi Mound Colony
Young scholars comprehend the basic units of measurement, scale, plotting, and basic grids. Students practice their estimation
and measuring skills and will demonstrate their ability to work well in groups.
Curated OER
Comparison of Two Different Gender Sports Teams - Part 3 of 3 Scatter Plots and Lines of Best Fit
Learners create a scatter plot for bivariate data and find the trend line to describe the correlation for the sports teams. In this scatter plot lesson, students analyze data, make predictions,and use observations about sports data...
Curated OER
Location, Location, Location: Using a Grid to Determine Context
Seventh graders are introduced to making inferences about artifacts. Using a grid system, they locate the artifacts and determine where they originated from. They use this information to make conclusions about the way people lived...
Curated OER
Mathematics Within: Algebraic Patterns
Pupils discover patterns in linear equations by playing a dice game to collect data. They graph the data and analyze the patterns of the lines created by the data. The class then compares the individual graphs to evaluate the position of...
Curated OER
Transformations
Seventh graders complete activities to perform transformations of various figures and describe the transformations. In this transformations instructional activity, 7th graders perform a translation, a rotation, and a reflection on graph...
Curated OER
Cracks on the Walls
Young scholars observe the cracks in school walls and pavements. For this geometry lesson, students explore the factors to be considered before building a structure. They complete a graphing and calculation worksheet after the lesson.
Curated OER
Worksheet 1, Basic Calculus Pre-Course Review
In this calculus worksheet, learners review topics they need to already understand in order to be successful in a basic calculus course. Topics include functions, linear equations, coordinate graphing, piece-wise formulation, exponents,...
Curated OER
Linear Progression
Learners use graphing calculators to graph lines and create tables of values. They perform an experiment using M&M's and slinkys, then create their tables based on their results.
Curated OER
Quadratics: vertex form
Students practice graphing quadratic equations to find the vertex of quadratic functions. They determine if the graph opens upward or downward as well as convert quadratic equations to vertex form from polynomial form. A lab version is...
Curated OER
Quadratics: Vertex Form
Learners practice graphing quadratic equations. They work to solve and equation involving finding the vertex using given formulas. Once their points have been graphed, students determine the direction in which the angle opens. Worksheets...
Curated OER
Bungee M&M's
Eighth graders experiment with M&M's and a cup attached to a spring to to simulate a bungee jump. They graph the results of the experiment and make predictions for continuing the experiment. They determine the "line of best fit."


