American Statistical Association
What Fits?
The bounce of a golf ball changes the result in golf, mini golf—and a great math activity. Scholars graph the height of golf ball bounces before finding a line of best fit. They analyze their own data and the results of others to better...
CK-12 Foundation
Graphs in the Coordinate Plane: Functions on a Cartesian Plane
Connect the dots to graph a linear function. Young mathematicians use an interactive to first plot provided points on a coordinate plane. They connect these points with a line and then answer questions about the slope and y-intercept of...
EngageNY
Analyzing a Graph
Collaborative groups utilize their knowledge of parent functions and transformations to determine the equations associated with graphs. The graph is then related to the scenario it represents.
Curated OER
Writing and Graphing Linear Equations on a Flat Surface
In this linear equations worksheet, students write the equation of a line with given characteristics. They identify the slope of a line and the y-intercept. Explanations and examples are provided at the beginning of the worksheet. This...
Curated OER
Writing Linear Equations
In this math activity, middle schoolers write the equations in slope intercept form for the equations that are graphed. They also create equations using slope and intercepts.
Curated OER
Topic 2.4 - Writing Linear Equations
In this linear equation worksheet, students solve 18 problems regarding slope-intercept, linear equations, parallel lines and perpendicular lines.
Curated OER
Graphing Linear Functions
In this linear functions worksheet, 9th graders solve and complete 30 different multiple choice problems that include graphing. First, they determine the expression that is equivalent to the given expression. Then, students determine the...
Curated OER
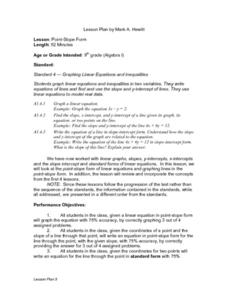
Point-Slope Form
Ninth graders explore the point-slope form of linear equations and graph lines in the point-slope form. After completing the point-slope equation, they identify the slope of a line through a particular point. Students explain the...
Curated OER
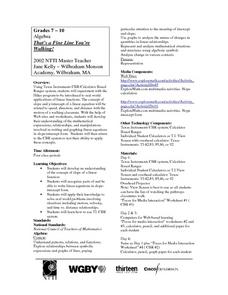
That's a Fine Line You're Walking!
Students experiment with Hiker program to practice real world applications of linear functions and develop their understanding of expressions, relationships, and manipulations involved in writing and graphing linear equations in...
Curated OER
Graphing Applications
In this graphing applications worksheet, students derive equations for 4 word problems. Students then define variables, find intercepts, graph the equations, and interpret the slopes.
Curated OER
The Slope of a Line
For this slope worksheet, students examine graph and determine the slope of a line. They determine coordinates of a point to make a true statement. Students identify the dependent variable and the independent variable. This three-page...
Curated OER
Finding Equations From Graphs
In this equations from graphs worksheet, 9th graders solve and graph 10 different problems that include determining the actual equation for each. First, they determine the slope and y-intercept for each graph shown on the right. Then,...
Curated OER
Slopes and Linear Equations
Students find the slopes of linear functions. For this graphing lesson, students analyze linear equations and calculate the slope of the line. They graph a line given the slope and y-intercept.
Curated OER
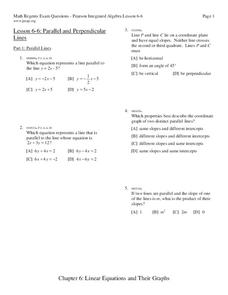
Parallel and Perpendicular Lines
In this algebra/geometry worksheet, students investigate the slopes and equations of parallel and perpendicular lines. The two page worksheet contains a combination of eleven multiple choice and free response questions. Solutions are...
Curated OER
Graphing Solutions
In this graphing solutions worksheet, 9th graders solve 13 various types of problems. First, they find the solution of each systems by graphing on the coordinate plane provided. Then, students solve each systems of equations...
Curated OER
Forces and Graphing
Young scholars analyze graphs to determine relationships between variables and rates of change. They determine the basic concepts about static reaction forces. They determine the slope and equation of a line.
Alabama Learning Exchange
Investigating School Safety and Slope
Learners investigate the slope of various stairways through a "news report" approach and employ mathematical knowledge of applied slope to report on wheelchair accessibility and adherence to Americans with Disabilities Act. They...
Curated OER
Algebra 1, Unit 7, Lesson 8: Practice Finding the Equation of a Line
Students solve systems of linear equations by graphing. The introduction of the lesson asks students to work in pairs or small groups to graph a line when given two points. Students graph 14 equations on the same coordinate grid to...
Mt. San Antonio Collage
Test 1: Functions and Their Graphs
Save the time creating an assessment because these function problems should do the trick. With 10 multi-part questions, they each focus on a different topic including radical, polynomial, linear and piecewise functions. The majority of...
Curated OER
Graphing Linear Equations with Calculator
Students graph lines using the calculator. In this algebra lesson, students graph lines of equations in the form y=mx+b. They input equations into the TI Calculator and graph using the slope and intercept. They analyze the graph for...
Virginia Department of Education
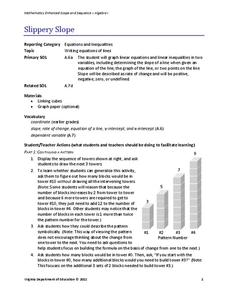
Slippery Slope
Explore slope using geometric patterns. Young mathematicians investigate towers built from cubes to develop a linear pattern. They move the data to a coordinate plane to connect the pattern to slopes.
Curated OER
Is there Treasure in Trash?
More people, more garbage! Young environmentalists graph population growth against the amount of garbage generated per year and find a linear model that best fits the data. This is an older resource that could benefit from more recent...
Curated OER
How Long Can You Go?
Eighth graders examine the usefulness of a line of best fit by collecting and graphing data, using a graphing calculator to determine the line of best fit, and making a variety of predictions. They watch a video, then design a...
West Contra Costa Unified School District
Graphing Systems
Get hands on with solving systems of equations graphically. A solid lesson plan uses guided practice to show how to solve systems of linear equations. It allows time for sharing ideas and provides a printable matching activity to promote...


