Radford University
Create A Ramp Design
Ramp up a design challenge. Class members design ramps to meet a client's requirements to comply with the American with Disabilities Act. The scholars create a scaled graph of their designs and determine the equations of the lines on...
Mathematics Vision Project
Modeling Data
Is there a better way to display data to analyze it? Pupils represent data in a variety of ways using number lines, coordinate graphs, and tables. They determine that certain displays work with different types of data and use two-way...
Curated OER
Algebra: Linear Equations
Students draw graphs of linear equations using the slope intercept form. Upon completion of various problems, students record their answers on the board and explain the solutions to classmates. Students take a test over the material...
Curated OER
Investigating Slope
In this investigating slope learning exercise, students use their graphing calculators to graph equations of a line with negative and positive slopes. They observe differences between the positive and negative slopes and write a rules...
Curated OER
Equation of a Line
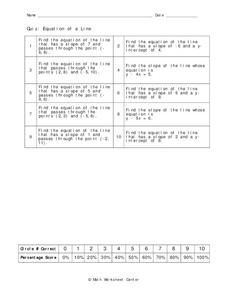
In this equation of a line worksheet, 9th graders solve 10 different problems that include the equation of a line. First, they determine the equation of a line that has a given slope and passes through a given point on a graph. Then,...
Alabama Learning Exchange
We Love to Graph!
Young scholars experience graphing points. In this graphing points instructional activity, students play an on-line game where they must name 10 coordinate pairs correctly. Young scholars play a maze game where they maneuver a robot...
Curated OER
Rocketsmania And Slope
Learners use a professional basketball team's data and graph it on a coordinate plane. They draw a line of regression and finding its equation. They access a website containing statistics for the Houston Rockets basketball team to solve...
Curated OER
Solving Systems by Graphing
In this solving systems by graphing worksheet, 9th graders solve and complete 5 different problems. First, they change each equation to graphing form. Then, students graph each line and find their point of intersection. In addition, they...
Curated OER
Finding Slope of a Line
Students calculate the slope of a line. In this algebra lesson, students graph a line using the slope and y-intercepts. They define the steepness of the line using the slope.
Curated OER
Graphing Functions
In this graphing functions worksheet, 10th graders solve 10 different problems that illustrate various graphs of functions. They determine the type of function that each graph shows. Then, students write the equation for the line graphed...
Alabama Learning Exchange
Graphing Stations
High schoolers explore the concept of graphing stations. In this graphing stations lesson, students head to various teacher set-up stations involving slope, point-slope, standard form, parallel lines, etc. High schoolers work problems...
Curated OER
Nine Exercises Matching Lines To Their Equations
In this math activity, students match the line of the graph with the corresponding equation. The goal is to practice finding the slope for each.
Curated OER
Graphing Linear Equations
Students graph linear equations. In this algebra lesson, students perform transformation on linear equations. They identify the slope and y-intercept of each line.
Curated OER
Reading Graphs
Students practice plotting functions on the Cartesian coordinate plane, see several categories of functions, including lines and parabolas, and read a graph, answering questions about the situation described by the graph
Curated OER
Chapter 3 Review
In this review worksheet, students read circle graphs and line graphs. They identify quadrants in a coordinate plane and match graphs to their appropriate linear equation. Students find the slope of a line and identify the y-intercept....
Curated OER
Practice Graphing y = mx + b
Ninth graders graph linear equations of the form y= mx + b. In this algebra instructional activity, 9th graders are able to graph a line given the slope and y-intercept. They can write the equations of a line given the graph of a line...
Curated OER
Plugging Into The Best Price
Examine data and graph solutions on a coordinate plane with this algebra lesson. Young problem-solvers identify the effect of the slope on the steepness of the line. They use the TI to graph and analyze linear equations.
Curated OER
Geometry: Parallel and Perpendicular Lines
This basic handout would be good for skills practice or a review of parallel and perpendicular lines. Review the definitions, then practice writing equations of lines that pass through a specific point and are either parallel or...
Curated OER
Exploring Linear Equations: Student Worksheet
An activity around linear equations, slope, and intercept is here for you. In it, young mathematicians engage in a whole-class activity while the teacher uses the overhead projector graphing calculator. This activity also focuses on...
Curated OER
Density of a Paper Clip Lab Review
Even though this assignment is brought to you by Physics Lab Online, it is best used as a math practice. Middle schoolers calculate the range, mean, mode, and median for a list of eight different paper clip densities. They analyze...
Illustrative Mathematics
Two Lines
Here is a resource that helps your algebra learners understand the connection between the graph of two lines, the equations of lines, and the solutions and intersecting points of lines. It would make a great assessment question, but can...
Curated OER
Graphing Linear Equations with Two Variables
Can your class solve linear equations in two variables? They will be able to after they engage in this lesson. Individuals graph linear equations in two variables using slope and intercept and identifying the relationship between the x...
Curated OER
Write an Equation of a Line Given Slope and a Point
Ninth graders are investigating slope of a line. The line is plotted using the slope and points on a line. They also write an equation given the right information. The use of a PowerPoint is part of the presentation.
Curated OER
Parallel Lines and Properties of Slope
Students define functions to be graphed using the Y=key. They demonstrate how to set up a standard viewing screen using Zoom 6. They discuss and explore mathematical questions on a worksheet.


