Alabama Learning Exchange
Graphing Stations
Pupils explore the concept of graphing stations. In this graphing stations lesson plan, students head to various teacher set-up stations involving slope, point-slope, standard form, parallel lines, etc. Pupils work problems at each...
Curated OER
The Gathering and Analysis of Data
Young mathematicians gather data on a topic, graph it in various forms, interpret the information, and write a summary of the data. They present their data and graphs to the class.
Curated OER
Graphing My Path to Success
Seventh graders examine their school performance through self-assessment of strengths and weaknesses. They construct a line graph, plotting all courses and achievements. Students use graph paper and colored pencils for each activity. If...
Curated OER
Quick Graphs of Linear Equations
Graph equations of lines using the slope-intercept method or by plotting both x and y intercepts. Determine if two lines are parallel or perpendicular by comparing their slopes. This handout includes step-by-step directions and four...
Curated OER
How Long Can You Go?
Eighth graders examine the usefulness of a line of best fit by collecting and graphing data, using a graphing calculator to determine the line of best fit, and making a variety of predictions. They watch a video, then design a...
Curated OER
Writing Linear Equations in Different Forms
Can your class write linear equations three different ways? Here is a study guide that includes slope-intercept, standard, and point-slope forms. Learners are given the slope and a point on the line, or two points and are asked to write...
Curated OER
Graphing Inequalities in Two Variables
This study guide is a great resource to help you present the steps to graphing linear inequalities. Show your class two different ways to graph an inequality and work on a real-world example together. The document could also be easily...
Curated OER
Profitable Soda Stand
Am I making any money? Help learners determine if their fictitious soda stand is turning a profit. They graph linear equations using the slope and y-intercept and identify the best price to use to sell soda. They identify the domain and...
Chapman University
Point-Slope Formula for a Straight Line
Single-page poster showing the point-slope formula and its graph. Put this up on the wall of your math room or use as a handout. This clearly displayed graph and algebraic explanation will get your charges thinking about what is it...
Utah Education Network (UEN)
Linear Graphs Using Proportions and Rates
Using a TI-73 or other similar graphing calculator middle school math majors investigate the linear relationship of equivalent proportions. After a brief introduction by the teacher, class members participate in a timed pair share...
West Contra Costa Unified School District
Point-Slope Application Problems
Create a linear equation for a problem when the intercept information is not given. The two-day lesson introduces the class to the point-slope form, which can be used for problems when the initial conditions are not provided. Pupils...
Curated OER
The Slope of a Line
Young scholars define the slope of a line as rate of change. They investigate positive, negative, zero, or undefined slope using a graphing calculator. They determine the slope of a line when given the equation of the line.
Curated OER
Lines in the Coordinate Plane
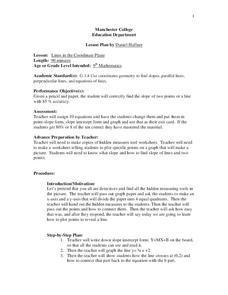
Students graph lines in a coordinate plane. In this geometry activity, students graph lines on a coordinate plane, and identify the slope. They classify the lines as parallel or perpendicular and write an equation of a given line.
Curated OER
Chart Your Course
Students explore change represented in graphs comparing distance and time. They exchange and share their graphs. Students interpret and create distance versus time line-graphs, and write stories based on these graphs. They interpret a...
Curated OER
Writing Linear Equations in Slope-Intercept Form
In this math worksheet, learners are given three lines graphed on a coordinate grid. Students identify the slope, intercepts, and write an equation for each. Learners find the intercepts of a linear equation, and graph them. They write...
Curated OER
Polar Graphs
Students graph polar graphs. In this calculus lesson, students convert between polar and rectangular coordinates. They graph their solution on the TI calculator and make observations.
Curated OER
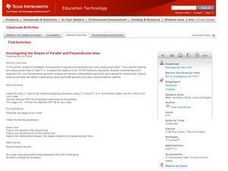
Investigating the Slopes of Parallel and Perpendicular Lines
High schoolers investigate parallel and perpendicular lines. They use Cabri Jr. to construct and explore the relationships between the slopes of parallel and perpendicular lines. The drawing and measurement tools available with Cabri Jr....
Curated OER
Eighteen Slope-Intercept Form of a Line problems
In this line worksheet, students solve eighteen problems related to slope, t-intercept, and equations of lines. Three of the problems are multiple choice, two are graphs, and the rest are free-response problems.
Curated OER
Linear Modelling of the Life Expectancy of Canadians
Middle and high schoolers explore the concept of linear modelling. In this linear modelling lesson, pupils find the line of best fit for life expectancy data of Canadians. They compare life expectancies of men and women, and find the...
Curated OER
Three Methods for Using Quadratic Functions to Model Data
For this modeling data worksheet, students use quadratic functions to model data using three different methods. This worksheet provides explanations and an example. Additionally, students are given the steps to find the maximum or...
Curated OER
Modeling Linear Relationships
Young scholars graph lines using the slope and y-intercept. In this algebra lesson, students create data using tables and equations. They use their data to make predictions and draw conclusion.
Curriculum Corner
8th Grade Math Common Core Checklist
Ensure your eighth graders get the most out of their math education with this series of Common Core checklists. Rewriting each standard as an "I can" statement, this resource helps teachers keep a record of when each standard was taught,...
Inside Mathematics
Sorting Functions
Graph A goes with equation C, but table B. The short assessment task requires class members to match graphs with their corresponding tables, equations, and verbalized rules. Pupils then provide explanations on the process they used to...
American Statistical Association
What Fits?
The bounce of a golf ball changes the result in golf, mini golf—and a great math activity. Scholars graph the height of golf ball bounces before finding a line of best fit. They analyze their own data and the results of others to better...


