Mathematics Assessment Project
Representing Inequalities Graphically
A new, improved version of the game Battleship? Learners graph linear inequalities on the coordinate plane, then participate in a game where they have to guess coordinate points based on the solution to a system of linear inequalities in...
Curated OER
Graphing Linear Equations
Ninth graders review the information that they have already learned
with regard to linear equations and graphical representations. They then assist in combining equations with a graphical element and complete various graphs with this...
Curated OER
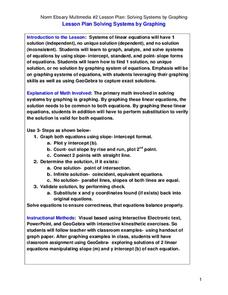
Solving Systems by Graphing
Students solve systems of equation through graphing. In this algebra instructional activity, students solve linear equations and analyze the result to figure out if there is one solution, no solution or infinitely many solutions. They...
Curated OER
Intersecting Lines and Vertical Angles
Pupils identify and define intersecting lines and vertical angles. They draw two intersecting lines and measure one pair of vertical angles. Learners will also move a line to change the angles of a figure and describe the changes in the...
Curated OER
Perpendicular Bisector of a Line Segment
High Schoolers investigate the perpendicular bisector of a line segment. They use Cabri Jr. to construct the perpendicular bisector of a segment. The dynamics capabilities of Cabri Jr. allow your learners to observe the lengths of the...
Texas Instruments
A Tale of Two Lines
Students graph systems of equation. In this calculus instructional activity, students graph their lines on a TI calculator. They identify the point of intersection and the type of solution.
Curated OER
Equations of Lines Perpendicular and Parallel
In this algebra worksheet, students solve linear equations using one and two steps. They solve systems of equations using substitution and elimination with graphing. There are links for ready made tests and quizzes.
Curated OER
Graphing and the Coordinate Plane
Students examine the four quadrants of Cartesian coordinate plane. They play maze games and coordinate games to discover how to read and plot points on the plane. Students plot points on the coordinate plane and examine the ratio of...
EngageNY
Polynomial, Rational, and Radical Relationships
This assessment pair goes way beyond simple graphing, factoring and solving polynomial equations, really forcing learners to investigate the math ideas behind the calculations. Short and to-the-point questions build on one another,...
California Education Partners
Science Fair Project
Plant the data firmly on the graph. Given information about the growth rate of plants, pupils determine the heights at specific times and graph the data. Using the information, scholars determine whether a statement is true and support...
Curated OER
Now That's Using Your Head!
Explore linear measurement. Scholars will measure the circumference of their head and the distance they can jump. Information is recorded, averages are calculated, and a data table is completed. They then determine possible relationships...
Texas State Energy Conservation Office
Investigation: Kinetic and Potential Energy
A well-developed lab sheet guides physical science learners through an investigation of kinetic and potential energy. In small groups, collaborators discover whether or not the ramp height or mass of an object has an effect on the...
Curated OER
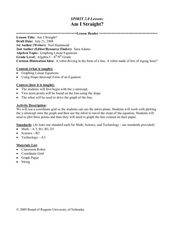
Am I Straight
Identify the slope of a linear equation in this algebra lesson. Middle schoolers graph linear equations using slopes and intercepts. They identify the slope as being positive, negative, no slope, or undefined.
Curated OER
Scattered About
Students are introduced to the concept of scatter plots after reviewing the various types of graphs. In groups, they analyze the type of information one can receive from a scatter plot and identify the relationship between the x and y...
Curated OER
Parabolas
In this parabolas learning exercise, 10th graders solve and complete 15 different problems related to parabolas. First, they define parabola and its information related to graphing one. Then, students write each equation in standard...
Curated OER
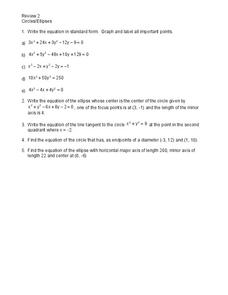
Circles and Ellipses
In this circles and ellipses worksheet, students solve and complete 5 different types of problems. First, they write each equation in standard form. Then, students graph and label Write the equation of the ellipse whose center is the...
Curated OER
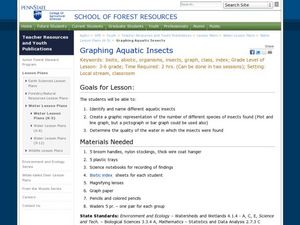
Graphing Aquatic Insects
Students identify aquatic insects. In this organism lesson, students locate aquatic insects near a local waterway and collect them. Students graph the amount of insects that they collected.
Curated OER
Ordering Rational Numbers and Finding Their Approximate
Middle schoolers explore the concept of ordering rational numbers on a number line. They represent rational numbers as decimals and percents. Pupils create a foldable about converting fractions to decimals to percents, and use a...
Curated OER
Linear Functions-Learn Your Lines
Students solve and graph linear equations. In this algebra lesson plan, students collect and plot data on a coordinate plane. They use the CBL and TI calculator to graph systems of equation.
Curated OER
Bar and Histograms (What Would You Use: Part 1)
Young scholars practice creating bar graphs using a given set of data. Using the same data, they create a group frequency chart and histograms. They must decide the best graph for the given set of data. They share their graphs with...
Curated OER
That's a Fine Line You're Walking!
Students experiment with Hiker program to practice real world applications of linear functions and develop their understanding of expressions, relationships, and manipulations involved in writing and graphing linear equations in...
Curated OER
Whose Line is it Anyway?
Students solve systems of equations. In this algebra lesson, students identify the domain and range of each function. They use the slope and y-intercept to graph each line.
Curated OER
Graphing and the Coordinate Plane
Students learn about the Cartesian coordinate plane, understand the four quadrants of the Cartesian coordinate plane, and plot points on the plane. Students read coordinates for a point from a graph and give the ratio of rise over run...
EngageNY
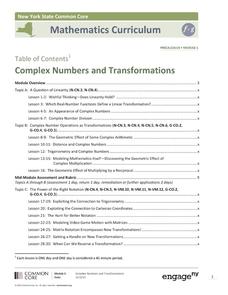
Complex Numbers and Transformations
Your learners combine their knowledge of real and imaginary numbers and matrices in an activity containing thirty lessons, two assessments (mid-module and end module), and their corresponding rubrics. Centered on complex numbers and...


