Curated OER
Topic 3.5 & 3.6: Linear Programming
In this linear programming learning exercise, students define variables and write a system of inequalities for the given situation. They model the solution through graphing. This two-page learning exercise contains six multi-step word...
Curated OER
MP3 Purchase Plans
Use algebra to solve real world problems. Mathematicians practice use of graphs, tables, and linear functions to solve a problem regarding mp3 purchase plans. They work in groups to solve the problem and present their findings and...
Mathalicious
Domino Effect
Carryout the lesson to determine the cost of pizza toppings from a Domino's Pizza® website while creating a linear model. Learners look through real data—and even create their own pizza—to determine the cost of each topping. They explore...
Curated OER
Systems of Linear Inequalities 2
Students solve systems of inequalities. In this lesson, they identify the solution of the two lines and shade the solution. They identify the boundary line and the region representing the solution.
Flipped Math
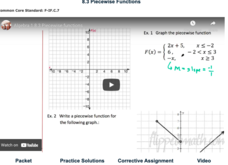
Piecewise Functions
Break it up into pieces to solve the problem. Individuals watch a video on how to graph and determine the equation and values of piecewise functions. Viewers then work several exercises to practice evaluating a piecewise function at...
Curated OER
Inequalities 7.3
Graph inequalities and discuss the difference in their slopes. Learners observe rate of change as they compare linear, quadratic, and cubic functions.
Curated OER
Linear Equations
This is a great lesson from start to finish. With partners and on their own, learners write and solve linear equations and inequalities. They use manipulatives, group work, and an included worksheet to make magic with their problem...
Curated OER
Solving Inequalities
This is a nice worksheet on solving one variable and compound inequalities. Learners solve inequalities and graph the solution on a number line. The two page worksheet contains explanation and sixteen practice problems.
Rice University
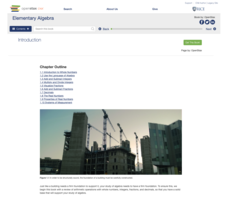
Elementary Algebra
Find all the Algebra 1 content in one location. A helpful eBook contains the content typically found in an Algebra 1 course. Concepts range from solving and graphing linear equations to solving and graphing quadratic equations. Pupils...
Virginia Department of Education
Solving and Graphing Inequalities
You can't go wrong with a lesson plan that involves candy! Learners solve and graph one-variable inequalities and use candy to graph the solution. Individuals associate open circle graphs with life savers and closed circle graphs with...
Curated OER
What Functions do Two Graph Points Determine?
Your algebra learners write linear, exponential, and quadratic equations containing the same two graph points in this collaborative task.
Teach Engineering
All About Linear Programming
Class members connect engineering with an understanding of linear programming using a technical resource. Scholars learn about linear programming (linear optimization) and how it applies to engineering design in the first of two modules....
Curated OER
Graphing Linear Inequalities
In this algebra worksheet, students graph inequality linear graphs and shade using a test point. There are 14 problems with an answer key.
MARS, Shell Center, University of Nottingham
Defining Regions Using Inequalities
Your young graphers will collaboratively play their way to a better understanding of the solution set produced by the combining of inequalities. Cooperation and communication are emphasized by the teacher asking questions to guide the...
Benjamin Franklin High School
Saxon Math: Algebra 2 (Section 9)
Section 9 of the 12 linked Saxon Math sections introduces the young algebrist to graphing periodic functions, creating graphs from quadratic roots, working with inequalities, and rational equations. Common among all the lessons is the...
Curated OER
Graphing systems of inequalities
In this graphing worksheet, high schoolers graph ten systems of inequalities. Students are then asked to find the area of the regions. A challenge problem is included. where high schoolers are asked to find the volume of the resulting...
5280 Math
More or Less the Same
Tell the story of the math. Given a graph of a linear system, learners write a story that models the graph before crafting the corresponding functions. Graphs intersect at an estimated point, allowing for different variations in the...
National Security Agency
Systems of Equations and Inequalities
High school classes can use manipulatives too! Offer hands-on, interactive lessons that venture away from the typical day in your algebra class. Young mathematicians will be involved in collaborative learning, visual representations, and...
Inside Mathematics
Sorting Functions
Graph A goes with equation C, but table B. The short assessment task requires class members to match graphs with their corresponding tables, equations, and verbalized rules. Pupils then provide explanations on the process they used to...
Curated OER
Linear Functions
Your learners will explore linear functions by analyzing a graph of the linear equations.Then learners analyze through calculating f(x+P) and g(x+p)
Kenan Fellows
Dinner Party: Using Pattern Trains to Demonstrate Linear Functions
Nothing fancy here ... just your run-of-the-mill Algebra party! Learners explore the patterns of linear functions while designing seating arrangements for a dinner party. Comparing the number of tables to the perimeter of the combined...
West Contra Costa Unified School District
Comparing Linear and Quadratic Functions
If a linear function and a quadratic function enter a boxing match, which one would win? Learners first review how to find key features of linear and quadratic functions. Next, they compare key features of pairs of functions.
Annenberg Foundation
Skeeters Are Overrunning the World
Skeeters are used to model linear and exponential population growth in a wonderfully organized lesson plan including teachers' and students' notes, an assignment, graphs, tables, and equations. Filled with constant deep-reaching...
Curated OER
Every Graph Tells A Story
Seventh graders explore linear equations. In this graphing lesson, 7th graders explore constant rates of change. Students discover the real-life application of graphs and demonstrate their ability to read graphs and write corresponding...


