Kenan Fellows
Density
Most scholars associate density with floating, but how do scientists determine the exact density of an unknown liquid? The third lesson plan in a seven-part series challenges scholars to find the mass and volume of two unknown liquids....
Curated OER
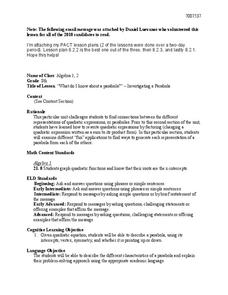
Investigating Parabolas
Students identify properties of parabolas. In this algebra instructional activity, students factor quadratic equations and identify the properties of parabolas. They find the roots, vertex and intercepts of a parabola.
Achieve
Ivy Smith Grows Up
Babies grow at an incredible rate! Demonstrate how to model growth using a linear function. Learners build the function from two data points, and then use the function to make predictions.
Curated OER
Parabolas
For this Algebra I/Algebra II worksheet, students identify the vertex and the axis of symmetry of a parabola, given the equation. The two page worksheet contains a combination of ten multiple choice and free response...
Curated OER
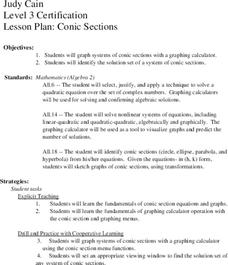
Conic Sections
Learners, while using a graphing calculator, graph systems of conic sections as well as identify their solutions. They complete various word problems dealing with conic sections with their calculators. In addition, students sketch graphs...
Curated OER
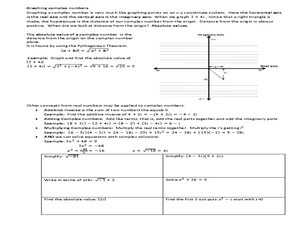
Complex Number
In this algebra instructional activity, students identify the vertex of a quadratic functions. They identify complex numbers. There are 6 questions.
Curated OER
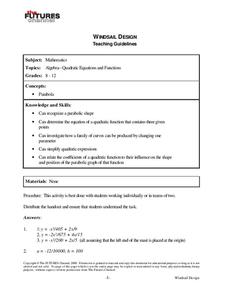
Windsail Design
Students fit quadratic models to windsail designs. In this fitting quadratic models to windsail designs lesson, students compare quadratic models of sails with different measurements and mast size. Students vary the a-value...
Curated OER
Polynomials and Linear Factors
This algebra worksheet reviews writing polynomials in standard form from factored form, looks at the graphs of polynomials of degree higher than two, and identifies the zeros of polynomials using the Factor Theorem and Fundamental...
Alabama Learning Exchange
Bloodstain Pattern Doesn't Lie......
An interesting instructional activity on hypothesizing about the diameter of a drop of blood that is splattered. To test their theories, learners work in groups to make blood droplets splatter from different heights. They use graphed...
Illustrative Mathematics
Modeling London's Population
Looking at London's population from 1801–1961 in 20 year increments, high school mathematicians determine if the data can be modeled by a given logistic growth equation. They explain their thinking and determine the values of each...
Curated OER
Complex Numbers
The class practices, on paper and/or on a TI graphing calculator the concepts of how to add, multiply, divide and subtract complex numbers using the correct property.
EngageNY
Linear Systems in Three Variables
Put all that algebra learning to use! Using algebraic strategies, learners solve three-variable systems. They then use the three-variable systems to write a quadratic equation given three points on the parabola.
Curated OER
Big Wheels Keep on Turning
Eleventh graders work in groups and investigate how force determines the speed and distance then they view the video, "Math Vantage #7: What's Your Angle?." They are given a real life problem to solve using speed, ramps, angle, incline...
Curated OER
Graphing Equations
Students use an interactive website or cd rom to graph equations. The lesson plan is not very clearly written. The use of the website is essential or the educational software that can be purchased from the Prentice Hall publisher.
Curated OER
Get a Half Life!
Eighth graders use M&M's to experiment with data. They use a graphing calculator to determine the best equation for their data; linear, quadratic or exponential. They analyze the data to find the half-life of their M&M's.
Curated OER
Parabolas
In this Algebra I/Algebra II worksheet, learners determine the vertex and the axis of symmetry of a parabola. The two page worksheet contains a combination of eleven multiple choice and free response questions. Answers are...
Curated OER
Properties of Parabolas
Learn to identify the properties of parabolas. High schoolers define parabola as the locus of all points equidistant from a fixed point and a fixed line. Also, interpret the equation for a parabola in vertex form and gain a visual...
Curated OER
Maximum and Minimum Word Problems
In this maximum and minimum worksheet, students solve and complete 10 various types of word problems. First, they find the numbers if the product of the square of one of the numbers with the cube of the other number is to be a maximum....
Illustrative Mathematics
Springboard Dive
Dive into this problem that illustrates a real-world application of the quadratic formula. Learners are given an equation that represents the height of a diver above the water t seconds after leaving the springboard. The task is to...
Curated OER
Solving Absolute Value Inequalities
Start this activity with a brief description of how to solve absolute value inequalities. A space is provided to help classify the inequalities into types (greater than, less than, or equal to) and for learners to show how to graph their...
Virginia Department of Education
Solving Linear Equations
Practice solving linear equations by graphing. Scholars learn to solve multi-step linear equations in one variable by graphing both sides of the equation separately. They use graphing calculators to find the intersection of the graphs.
Curated OER
Mathematical Relationships
Pupils practice graphing a linear equation and a parabolic equation. They work cooperatively to select numbers, including fractions, which they will put into ordered pairs. Students explain their process to the class, discussing what...
Inside Mathematics
Printing Tickets
Determine the better deal. Pupils write the equation for the cost of printing tickets from different printers. They compare the costs graphically and algebraicaly to determine which printer has the best deal based upon the quantity of...
Mathalicious
Domino Effect
Carryout the lesson to determine the cost of pizza toppings from a Domino's Pizza® website while creating a linear model. Learners look through real data—and even create their own pizza—to determine the cost of each topping. They...


