Curated OER
Farm Stories, Animal Webbing, Favorite Farm Animal Graph
Students brainstorm animals they would expect to see on a farm. They save these on a Kidspiration web. Students watch or read a farm story. They discuss the characters. Students vote for their favorite farm animal and crate a graph using...
Curated OER
Interpreting Graphs
In this algebra worksheet, students interpret graphs using given data and information. They are asked to relate real world scenario using algebraic equations. There are 31 questions with a variety of topics being covered.
Curated OER
Surveys and Graphing
First graders survey different classrooms to determine types of products students would like to see sold at school, and create graphs based on survey results.
Curated OER
Geometry: Helix-a-Graph
Students use geometry to create art. In this geometric graphing and patterns lesson, students create a helix-a-graph by plotting points on a grid that follow a certain pattern and analyze the drawing they created.
Curated OER
Graphing Surveys and Analyzing Data
Students analyze data and graph the results of their surveys. In this statistics lesson, students create graphs using excel to make graphs to be able to better observe their data. They conclude how great we as unique individuals.
Curated OER
Meeting and Reading Dr. Seuss
Second graders demonstrate competence in the general skills and strategies of the reading process.
Curated OER
Graphs of Formulas
In this worksheet students fill out a function table after reading a short word problem. This is a good way for students to practice the necessary skills for solving word problems or setting up algebra equations.
Curated OER
Where Am I: How to Read a Map
Third graders develop an understanding of maps. They explore what a map is, who uses maps, and how to use maps. Students investigate the compas rose. They create a compose rose which illustrates the cardinal directions. Students practice...
Curated OER
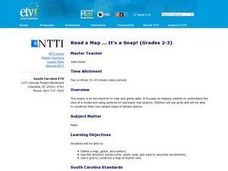
Read a Map ... It's a Snap!
Students are introduced to map and globe skills. They use grids and are able to construct their own simple maps of familiar places. Students are able to define a map, globe, and symbol and use the direction words north, south, east,...
Curated OER
Read Aloud: "The Bookshop Dog"
Students listen to the book "The Bookshop Dog" and discuss what happens when there is a change in their lives. They create a class T-chart about changes and feelings, develop a graph related to the story, and define key story vocabulary...
Curated OER
Discussing Non-Fiction Texts
Discuss non-fiction texts and fact and opinion. Learners discuss the features of non-fiction text, identify how to distinguish fact from opinion, and list ways to display information, including graphs, charts, and diagrams. While this is...
Curated OER
Graphing Data
Second graders examine how to make and read bar graphs. In this bar graph lesson plan, 2nd graders compare bar graphs to pictographs by looking at hair color survey data. They practice making a bar graph and finding the range of the data.
Curated OER
Getting Graphs: Researching Genealogy-A Piece of Pie
Third graders research their genealogy. For this math lesson, 3rd graders collect data and create graphs and charts. A presentation of their findings is given.
Curated OER
Bald Eagle Population Graphing
Students create graphs to illustrate the bald eagle population. They identify the population of bald eagles in Minnesota and the United States. They create three graphs to represent the population data including a line, bar, and...
Curated OER
Line Graphs
Seventh graders create a line graph and identify when to use line graphs. In this line graphs lesson, 7th graders analyze the average temperatures of various cities. Students graph the data they collected.
Curated OER
Graph: Number of Laysan Albatross Nests and Chicks at Kilauea Point
In this bar graph worksheet, students solve and complete 2 problems related to reading a bar graph. First, they use the data table found at the bottom of the sheet to complete the bar graph which illustrates the number of nests and...
Curated OER
Road Runner Reading
Young scholars identify that fluency helps them to read faster, smoother, and with more expression. They read a book where a pet dog named Red is hungry and wants her owner to give her food. Students practice quick reading by reading...
Curated OER
Explore: Collect And Organize Data
In this exploring how to collect and organize data worksheet, students, working with a partner, problem solve the answers to seven word problems involving data.
Curated OER
Making the Grade: College Level Study Skills
Students discuss their most difficult college text. They take a questionnaire that analyzes their note taking styles and skills and then identify the appropriate way to study for a college level exam.
Inside Mathematics
Population
Population density, it is not all that it is plotted to be. Pupils analyze a scatter plot of population versus area for some of the states in the US. The class members respond to eight questions about the graph, specific points and...
Science 4 Inquiry
The Ups and Downs of Populations
As the reality of population decline across many species becomes real, pupils learn about the variables related to changes in populations. They complete a simulation of population changes and graph the results, then discuss limiting...
Edmond Public Schools
8th Grade Science Resource Book: Unit 2 - Physics
Get things moving with this extensive collection of physical science resources. Covering the fundamentals of measurement, graphing, lab safety, and experimental design as well as the specific scientific concepts of velocity,...
West Contra Costa Unified School District
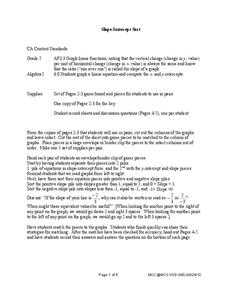
Slope-Intercept Sort
What's so special about slope? Pupils first match cards with slope and y-intercept to graphs of linear equations. They continue the lesson by matching equations in slope-intercept form to the same graphs.
National Wildlife Federation
Hot, Hotter, Hottest: Extreme Weather's Impact on Our Resources
How dry is it? It's so dry, the river only runs twice a week! Through an analysis of maps and discussions, pairs learn about droughts across the United States in the ninth of 12 lessons. They then read about, answer questions, analyze...


