Worksheet Web
Using Pictographs
If one ice cream cone represents three ice cream scoops, and Bob has four ice cream cones, then how many scoops does Bob have? Learners solve these kind of questions with their new understanding of pictographs.
Teach Engineering
The Challenge Question
A research position becomes a modeling job. The introductory lesson in a series of nine presents the challenge of analyzing a set of bivariate data. The class brainstorms what the data may represent. Pupils must decide what is needed to...
Curated OER
Nicotine addiction and youths
Young scholars read CNNfyi article: "Nicotine addiction can begin in days, study says," and have class discussion about the effects of nicotine on the human body.
Spectrum
Grade 5 Standardized Test Prep
Here you'll find a great sampling of practice standardized test questions organized into four sections: ELA, mathematics, social studies, and science. Help your learners become familiar with the types of multiple-choice questions...
Chicago Teachers Union Quest Center
Factored Form of a Quadratic Function
Build upon linear functions to learn about quadratics. The lesson plan introduces the concept of zeros for quadratic functions and makes the connection to the linear factors of the function. It presents quadratics in both graphical and...
Open Text Book Store
Arithmetic for College Students: Worksheets
Loaded with concepts ranging from multiplying decimals to converting units to solving problems using the order of operations, a thorough practice packet is perfect for a fifth or sixth grade math classroom.
Mathed Up!
Frequency Polygons
Frequency polygons are a different way to represent frequencies over intervals. Pupils take frequencies for intervals of data from a frequency table and plot them as a frequency polygon. Budding mathematicians find information about the...
Curated OER
If Our Class Went to See the Prince
First graders read the story One Monday Morning and create picture graphs based on the number of teachers, boys, and girls that would visit the prince. In this data lesson plan, 1st graders interpret tables and graphs with the help of...
Curated OER
Math is Everywhere!
In this everyday math skills pretest, students answer ten multiple choice questions based on their knowledge of everyday math skills such as estimation, addition, and measurement.
Curated OER
Food Label Fun
Third graders demonstrate how to read and analyze food labels. In this nutrition lesson, 3rd graders watch a food label video and investigate labels from various canned foods. Students create a chart showing the percentage of vitamins...
Curated OER
Away We Go!
Students study types of transportation. In this transportation instructional activity, students survey several classes to gather data on how they get to school. Students create a transportation graph.
Curated OER
How Many People Live in Your Household?
Students create a pictograph showing household size for the class.In this data collection and graphing lesson, the teacher guides students through the creation of a concrete object graph, then students analyze and summarize the results.
Curated OER
Activity Plan 3-4: Scrumptious Shapes
Students discover together that shapes are everywhere - even in the food we eat. In this early childhood math and art lesson plan, students read about shapes, identify foods that match geometric shapes, and create a class book.
Curated OER
A Plop and Fizz
Seventh graders perform an experiment to determine the effect of temperature on reaction rates. In this chemistry lesson, 7th graders take measurements and record data. They create a graph and analyze results.
Curated OER
Eatem Up!
Students identify, interpret and demonstrate a positive learning attitude. They identify, comprehend and use basic concepts and skills and then, communicate clearly in oral, artistic, written, and nonverbal form. Students also identify...
Curated OER
Are We Couch Potatoes or Busy Bees? Data Analysis of Physical Activity in School
Students study practical data analysis within the constraints of the scientific method. In this data instructional activity students collect and enter data into a computer spreadsheet then create graphs.
Curated OER
On the Seashore
Students read the book On the Seashore and complete activities such as reading a book, color and cut out animal cards, model rock making, shell graphing, shell patterns, and more. In this seashell lesson plan, students use the sea shells...
Curated OER
Survey and Tally
Second graders view a model of a survey and tally. In this survey and tally lesson plan, 2nd graders decide on questions for a survey. Students conduct the survey and tally their results. Students create a tally chart. Students view a...
Curated OER
Wordle It
Students discuss, define, and give themselves character traits. In this character traits instructional activity, students create a list of ten character traits that describe themselves. Students create a data table and poll their...
Curated OER
Math Investigations 2
Young mathematicians practice measuring and graphing skills while working in groups to measure objects found in the classroom. Using their measurements, they create one bar graph displaying the lengths and another displaying the widths.
Curated OER
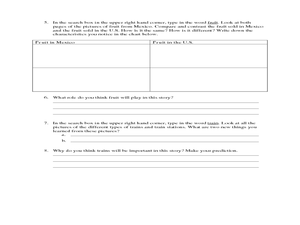
Esperanza Rising - Anticipation Guide
Learn about Mexican culture while simultaneously strengthening reading, writing and computer skills. In order to get the most out of Esperanza Rising, pupils should have prior knowledge of Mexican culture. Therefore, there are links to a...
Curated OER
Water: From Neglect to Respect
The goal of this collection of lessons is to make middle schoolers more aware of the ways in which they are dependent upon water to maintain their standard of living. Learners compare water use in Lesotho to water use in the United...
Center Science Education
Investigating the Climate
What do graphs of atmospheric gases over time show us? Do they indicate that carbon sources and carbon sinks are not in balance? Up-and-coming meteorologists watch video clips, read information, and analyze data from the HIPPO (HIAPER...
Curated OER
Solar Heating in the Himalayas
A fascinating lesson on how solar power is utilized by people who live in the Himalayas is here for you. In it, learners perform a case study which will help them understand that solar energy is a renewable resource, that geography...


