Curated OER
Survey Say...
Students examine a variety of charts and graphs that present data in a format that is easy to read. They work in groups to conduct a survey amongst their classmates. The data collected from the survey is then put on a bar graph.
Curated OER
Math Made Easy
Students evaluate word problems. For this problem solving lesson, students are presented with word problems requiring graphing skills and students work independently to solve.
Curated OER
Enhancing Writing Through Technology
Students participate in a class survey of their favorite activity to do in the snow and organize the results in a graph. They write a paragraph about the graph using language from a class-developed word web and include both an opening...
Curated OER
What's Your Favorite Planet?
Fourth graders interpret a graph and make correlations using data. After taking a class survey, 4th graders create a class graph of their favorite planets. Working in small groups, they interpret the information and create at least ten...
Curated OER
Graph Your Foot!
Students measure their own foot and place the outline on a graph. They make connections between the size of their foot and the bar graph that represents it.
Curated OER
Introduction to Graphical Representation of Data Sets in Connection to Cellular Growth
Students practice graphing relationships between variables by studying topics such as exponential growth and decay. They conduct a series of numerical experiments using a computer model and a variety of physical experiments using mold,...
Curated OER
Apple Eaters
Students sample a variety of apples and graph group results for the class favorites. They orally explain the graph.
Curated OER
Bar Me In
Fourth graders watch a video about constructing bar graphs. They create their own graph and interpret it.
Curated OER
Learning to be a Super Speedy Reader
Students review the steps to follow when they come to a word that they do not know, review blending, and the body and coda part of the word. They time the teacher as she reads for one minute using the clock on the wall. They then read...
Curated OER
Going My Way?
Learners discuss how each one of them leaves school each day. They create and analyze a class graph displaying the information collected.
Curated OER
Points in the Complex Plane -- Lab
Learners review the lecture portion of this lesson. Individually, they graph various points on a complex plane and identify conjugates based on their location on the graphs. They complete a worksheet and review their answers to end the...
Curated OER
Education for Global Peace
Fifth graders construct data graphs based upon sets of data. In this graphing lesson, 5th graders read the text If the World Were a Village and discuss how types of graphs accurately represent a large population. Students construct their...
Curated OER
The 400-Meters Race
Learners collect and graph data. In this algebra lesson, students describe, interpret and analyze data. They follow a 400 meters race and plot the coordinates of the course. They graph a line to represent the data of the course.
Curated OER
Valentine Candy Count
Students investigate what color Valentine Candy is found more often than any other in a standard bag of "Valentine Conversation Hearts." They sort, classify and graph their findings.
Curated OER
Science and Technology
Students research inventions that have been created. In this historical technology lesson plan, students read the Harcourt Brace social studies textbook and discuss how inventors used graphs to display data. Students create a table to...
Curated OER
Interpreting Medical Data
Students explore human anatomy by graphing scientific data. In this vision lesson, students discuss how ophthalmology works and take their own eye assessment test using the Snellen chart. Students collect vision data from all of their...
Curated OER
An Apple a Day
Students study apples and then paint apples whichever color is their favorite apple color. They help create a bulletin board for the classroom. They graph the different colors of apples found on the board.
Curated OER
What's The Weather?
Second graders record and summarize daily weather observations for a week in the form of a bar graph. They cut and glue a weather symbol for each day, record it on the graph, and answer discussion questions.
Curated OER
A Country’s Shape Is More Than Its Borders
In this geography skills worksheet, students read an article and examine graphs about population prior to answering 13 short answer questions and 10 multiple choice questions. Students then respond to the writing prompt about population.
Curated OER
Baseball Math
Students collect data on baseball plays. In this statistics lesson, students graph their data and make predictions based on their observation. They calculate what the probability is that a favorable outcome would happen.
Curated OER
Weather Awareness
Second graders investigate weather. In this weather lesson, 2nd graders discover how to read a temperature gauge, keep track of the weather, and find out how the weather affects their day. They work individually and in partners to make...
Curated OER
Remembering the First
Learners examine words and phrases associated with World War I as an introduction the era. They explore the legacy of World War I by reading and discussing "The War to End All Wars If Only." Students write obituries for fallen World...
Curated OER
Identifying Implications
Learners read a variety of reading passages and articles. They investigate how to make implications and assumptions using the information provided.
Curated OER
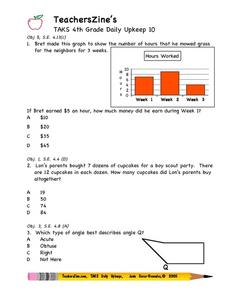
TAKS 4th Grade Daily Upkeep 10
For this math worksheet, 4th graders look for the answers to basic review problems that focus upon the skills of reading simple word problems, and applying the interpretation of data.


