Royal Baloo
Star Wars K-2nd Math Pack
Included in a Star Wars themed packet, young padawans enhance mathematical skills such as graphing, computing using basic operations, counting numbers and money, telling time, and measuring. Scholars play a game of sudoku, read number...
Texas State Energy Conservation Office
Investigation: Kinetic and Potential Energy
A well-developed lab sheet guides physical science learners through an investigation of kinetic and potential energy. In small groups, collaborators discover whether or not the ramp height or mass of an object has an effect on the...
Math Stars
Math Stars: A Problem-Solving Newsletter Grade 6
Think, question, brainstorm, and make your way through a newsletter full of puzzles and word problems. The resource includes 10 different newsletters, all with interesting problems, to give class members an out-of-the box math experience.
Curated OER
Great Graphing!
In these graphing worksheets, students learn to read graphs and answer questions by studying the graphs about the classroom pet, shirt colors, and breakfast food.
Curated OER
Tips for Studying History
In this historical analysis learning exercise, students read the 6 tips for studying historical time periods and then read a 1-paragraph selection about the Chinese approach to history and respond to 3 short answer questions.
Brigham Young University
K-W-H-L for Harry Potter and the Chamber of Secrets
To prepare for a study of Harry Potter and the Chamber of Secrets, the second in the series of seven books about J.K. Rowling's amazing young wizard, readers complete a K-W-H-L chart.
Miami University
Chapter Nine Worksheet: Monopoly
Advanced economics pupils analyze a series of graphs, data sets, and profit scenarios all related to monopolies and marginal revenue. They read through the background information, complete a graph using the data provided, and justify...
Curated OER
Using Data
In this analyzing data activity, 4th graders read, study and interpret a bar graph on how many hours Millie spends a week drawing each day. Students answer 2 short answer questions relating to the bar graph.
Curated OER
Data Analysis 2
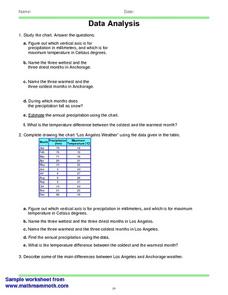
In this data analysis worksheet, students read and interpret given line graphs. They determine the range and average. This one-page worksheet contains five problems.
Curated OER
Graphing Ordered Pairs
In this math worksheet, students learn to graph ordered pairs. Students examine a graph with 3 labeled points and tell the ordered pairs for each. Students also plot 8 ordered pairs on a graph they draw themselves.
Illustrative Mathematics
Downhill
A car traveling down a steep hill is the model for this resource. The confusion comes when the elevation, E, is given in terms of distance, d. The distance, d, is the horizontal distance from E. Therefore, the equation, E = 7500 – 250d,...
Mathed Up!
Histograms
Class members explore how to read and use histograms by watching a video on creating and analyzing histograms. To finish, the class works on a set of questions that tests these skills.
Curated OER
Reading Frequency Tables
In this data interpretation instructional activity, students record the data from 10 examples into frequency tables. They group 10 more data sets, and make a frequency table for each.
Curated OER
Problem Solving 1
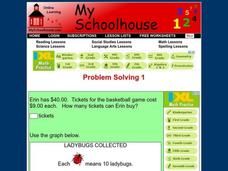
In this online interactive problem solving worksheet, students read a graph and use their problem solving skills in order to respond to 10 questions.
Curated OER
Too Many Tulips
In this graphing information activity, students read 6 sentences and then fill in the chart with the appropriate information from the sentences.
Curated OER
Problem Solving 1
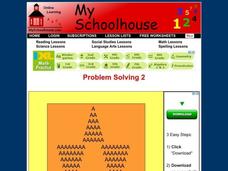
In this online interactive problem solving worksheet, students examine a diagram and use their problem solving skills in order to respond to 5 questions.
Curated OER
Big Pumpkins
For this pumpkin worksheet, students study a chart of the largest pumpkins grown. Students use the given data to answer 7 short answer questions.
Curated OER
Make a Tally
In this tally chart learning exercise, students read the word problems and use the information within the problem to make a tally chart. Students use the tally charts to help them finish and solve the word problem.
Curated OER
Make a Graph
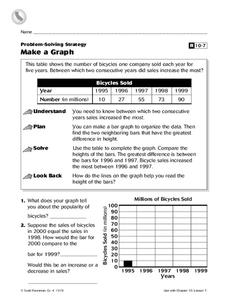
In this graphs worksheet, 4th graders, after studying and analyzing a table on bicycles sold within several years, answer 2 short answer questions relating to the table.
Western Education
Math Poems
The logic, rhythm, and beauty of math sometimes get lost amidst numbers and variables. Amplify math's lyricism with a poetry project that uses metaphors and similes to compare mathematical concepts to other images.
Worksheet Web
Using Pictographs
If one ice cream cone represents three ice cream scoops, and Bob has four ice cream cones, then how many scoops does Bob have? Learners solve these kind of questions with their new understanding of pictographs.
Spectrum
Grade 5 Standardized Test Prep
Here you'll find a great sampling of practice standardized test questions organized into four sections: ELA, mathematics, social studies, and science. Help your learners become familiar with the types of multiple-choice questions...
Chicago Teachers Union Quest Center
Factored Form of a Quadratic Function
Build upon linear functions to learn about quadratics. The lesson introduces the concept of zeros for quadratic functions and makes the connection to the linear factors of the function. It presents quadratics in both graphical and...
Open Text Book Store
Arithmetic for College Students: Worksheets
Loaded with concepts ranging from multiplying decimals to converting units to solving problems using the order of operations, a thorough practice packet is perfect for a fifth or sixth grade math classroom.


