Curated OER
Sedimentation in the Grand Canyon
In this sedimentation worksheet, students use the current rate of sediment deposit by the Colorado River in the Grand Canyon to answer questions about the changes taking place in the canyon. They graph the amount of deposit over 75 years...
Curated OER
Twinkle, Twinkle, Little Star Lab
In this space science worksheet, 7th graders use the star circles given but the teacher to complete 14 short answer questions. They plot the stars on the graph.
Curated OER
The Reaction Between Magnesium and Hydrochloric Acid
In this rate of chemical reactions worksheet, students experiment with different concentrations and volumes of hydrochloric acid mixed with magnesium. They measure the rates of the reactions and analyze their results from a graph they...
Curated OER
Surface Area of a Leaf (Grades 7-9)
In this math and science worksheet, students read about the process of photosynthesis and plant growth. They determine how a plant's ability to create food is dependent on the surface area of its leaves using geometric calculations. They...
Curated OER
Sound
In this sound worksheet, students read about sound waves, how they are graphed, what frequency is and how it's related to pitch and the speed of sound. Students solve 8 sections of problems including matching terms related to sound to...
Curated OER
Cosmic Rays and Solar Cells
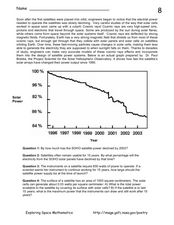
In this cosmic rays and solar cells worksheet, students read about how cosmic rays damage the electrical output of solar cells over time on satellites. Students use a graph of the solar power output compared to the year for the SOHO...
Curated OER
Global Meltdown
In this environmental science lesson, students study data and animation on global temperature increase to complete 8 short answer questions that follow.
Curated OER
Prime Numbers
For this prime numbers worksheet, students read facts and complete comprehension activities. In this graph construction and drawing worksheet, students complete two activities.
West Contra Costa Unified School District
Talking About Distance, Rate and Time
Connect the tortoise and the hare fable to mathematics. Learners first identify key terms related to distance, rate, and time. They then solve distance/rate/time problems using different representations.
Noyce Foundation
Ducklings
The class gets their mean and median all in a row with an assessment task that uses a population of ducklings to work with data displays and measures of central tendency. Pupils create a frequency chart and calculate the mean and median....
Code.org
Good and Bad Data Visualizations
Good versus bad data. Pairs rate online collections of data representations from good to bad and then suggest ways to improve the visualizations. The class then creates a list of best practices and common errors in data representations...
Inside Mathematics
Rhombuses
Just what does it take to show two rhombuses are similar? The assessment task asks pupils to develop an argument to show that given quadrilaterals are rhombuses. Class members also use their knowledge of similar triangles to show two...
Virginia Department of Education
Normal Distributions
Pupils work to find probabilities by using areas under the normal curve. Groups work to calculate z-scores and solve real-world problems using the empirical rule or tables.
California Education Partners
Yum Yum Cereal
Design an efficient cereal box. Scholars use set volume criteria to design a cereal box by applying their knowledge of surface area to determine the cost to create the box. They then determine whether their designs will fit on shelves,...
Houghton Mifflin Harcourt
Intensive Math
Three chapters worth of integer, fraction, and decimal problems to give you every type of question your learners need to be a successful mathematician. Thankfully the work has been done for you and this is a huge resource full of...
Keep it Simple Science
The Earth in Space
Skim the surface of the earth with this brief, compact, summary of outer space. The sun, stars, galaxies, planets, and phases of the moon can be found in this all-in-one resource. Seventh graders will enjoy these simple worksheets to do...
Computer Science Unplugged
Colour by Numbers–Image Representation
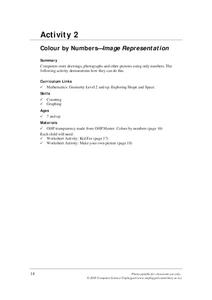
How do computers store and send images? Here's an activity that explains one way a computer can compress image information. Pupils decode run-length coding to produce a black and white image. Pairs then work together to code and decode...
Teach Engineering
Density Column Lab - Part 1
Mass and density — aren't they the same thing? This activity has groups use balance beams and water displacement to measure several objects. The pupils use the measurements to calculate the density of the objects.
Teach Engineering
Density Column Lab - Part 2
Groups suspend objects within layers of liquids to determine the densities of different liquids and compare them to the densities of objects calculated in Part 1. The groups then carefully test their calculations by layering the liquids...
Curated OER
How Markets Allocate Resources
Students study how markets allocate resources, students read background, analyze graphs, and make predictions about the impact of variables on the curves.
Curated OER
Notes to Quadratic Equations
In this quadratic equations worksheet, students read notes about graphing, factoring, square roots, completing the square, and the quadratic formula. Students read 2 1/2 pages of notes.
Curated OER
Function Investigation
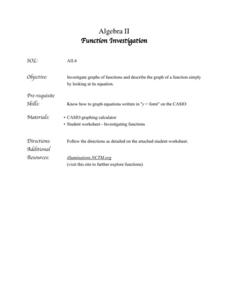
In this functions worksheet, 11th graders solve and complete 18 different problems. First, they graph each equation on the graphs provided, making a rough sketch on a coordinate plane. Then, students predict what each graph will look...
Curated OER
Novel Response "The Night of The Twisters"
In this language arts worksheet, learners graph interest in each chapter that is read in the book Night of The Twisters. They use the graph to analyze class opinion of the book.
Curated OER
Discovering Growth Patterns
In this statistics worksheet, high schoolers examine data on a variety of subjects related to growth patterns and apply the data to 4 different graphs.


