Curated OER
Graphing Linear Equations
In this graphing linear equations instructional activity, 9th graders solve and graph 6 different problems that include various linear equations. First, they graph each equation using the x- and y-intercepts of each. Then, students graph...
Curated OER
Write the equation of a line, given slope and a point
Young mathematicians write equations of lines in this algebra lesson. They solve linear equations into the slope intercept form. Next, they graph the lines using the slope and the y-intercept, and they write equations for the lines using...
Alabama Learning Exchange
We Love to Graph!
Young scholars experience graphing points. In this graphing points instructional activity, students play an on-line game where they must name 10 coordinate pairs correctly. Young scholars play a maze game where they maneuver a robot...
Curated OER
What Functions do Two Graph Points Determine?
Your algebra learners write linear, exponential, and quadratic equations containing the same two graph points in this collaborative task.
Curated OER
Graphing Linear Equations Using Data Tables
Learners review the Cartesian plane and the process of plotting points. In groups, students create tables, identify the slope and y-intercept, and graph the equation. Afterward, learners perform the same process, only, individually. As a...
Curated OER
Manipulating Graphs
Learners graph real life situations. In this graphing lesson, students read situations and write an equation that matches. They graph the situations and analyze the slope and y-intercept
Curated OER
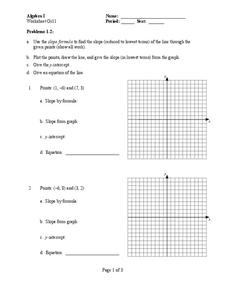
Graphing Linear Equations
In this Algebra I worksheet, 9th graders write the equation of a line given the slope and the y-intercept and determine the equation of a line given the graph. The five page worksheet contains twenty-eight problems. Answers are not...
BW Walch
Solving Systems of Linear Equations
Solving systems of equations underpins much of advanced algebra, especially linear algebra. Developing an intuition for the kinds and descriptions of solutions is key for success in those later courses. This intuition is exactly what...
Illustrative Mathematics
Distance across the channel
Here you will find a model of a linear relationship between two quantities, the water depth of a channel and the distance across the channel at water level. The cross section of the channel is the shape of an isosceles trapezoid. The...
Curated OER
Functions and Relations
In this functions and relations worksheet, 11th graders solve and complete 15 various types of problems. First, they find the slope and y-intercept for each function given. Then, students find the slope of the line passing through the...
Curated OER
Introducing Linear Terminology
Ninth graders graph linear equations and inequalities in two variables and then, they write equations of lines and find and use the slope and y-intercept
of lines. They use linear equations to model real data and define to define the...
Curated OER
Linear Equations
For this Algebra I worksheet, 8th graders write the equation of a line given two points and given a linear equation determine the slope, x-intercept, y-intercept, and graph the line. The five page worksheet contains ten problems. ...
Curated OER
Linear Equations
In this Algebra I worksheet, students determine the graph of the equation of a line. Students determine the x- and y-intercepts and graph. The three page worksheet contains six problems. Answers are not provided.
Curated OER
Discovering the Linear Relationship between Celsius and Fahrenheit
Students discover the linear relationship between degrees Farenheit and degrees Celsius. They manually compute the slope and y-intercept of the line passing through points. They convert Celsius to Fahrenheit degrees.
Curated OER
Investigating Slope
In this investigating slope learning exercise, students use their graphing calculators to graph equations of a line with negative and positive slopes. They observe differences between the positive and negative slopes and write a rules...
Curated OER
Rocketsmania And Slope
Learners use a professional basketball team's data and graph it on a coordinate plane. They draw a line of regression and finding its equation. They access a website containing statistics for the Houston Rockets basketball team to solve...
Curated OER
Graphing Functions
In this graphing functions worksheet, 10th graders solve 10 different problems that illustrate various graphs of functions. They determine the type of function that each graph shows. Then, students write the equation for the line graphed...
Curated OER
Write the Equation of a Line Given the Slope and a Point
Students write the equation of a line given the slope and y-intercept. In this algebra lesson, students are given a point a the line and the slope of the line and are asked to write an equation of the line. They relate lines to real life...
Curated OER
Slope of a Line
In this slope of a line worksheet, 9th graders solve and graph 10 different problems that include determining the slope of a line. First, they determine the slope of a line that contains two given points. Then, students determine the...
Curated OER
Eighteen Slope-Intercept Form of a Line problems
In this line worksheet, students solve eighteen problems related to slope, t-intercept, and equations of lines. Three of the problems are multiple choice, two are graphs, and the rest are free-response problems.
Curated OER
Solving Linear Systems by Graphing
In this linear systems worksheet, 9th graders solve and complete 4 different problems by graphing. First, they graph the first equation shown. Then, students graph the second equation on the same coordinate system as the first. They also...
Curated OER
Lines, Lines, Everywhere
Students explore linear equation suing real life scenarios. In this algebra lesson, students find the slope and intercept of a line. They create table of values to plot their graph and draw conclusions.
Curated OER
Parallel Lines and Properties of Slope
Students define functions to be graphed using the Y=key. They demonstrate how to set up a standard viewing screen using Zoom 6. They discuss and explore mathematical questions on a worksheet.
Curated OER
Baseball Relationships - Using Scatter Plots
Students use graphing calculators to create scatter plots of given baseball data. They also determine percentages and ratios, slope, y-intercepts, etc. all using baseball data and statistics.


